


.svg)

.svg)


Testing
TESTING

Automated testing to validate user experiences across real devices, networks, and channels.
Features
CHANNELS
Automated testing to validate user experiences across real devices, networks, and channels.
Imagine your digital ecosystem as a fast-growing city. Thousands of users move through it every day, browsing, signing in, and buying. Behind the scenes, dozens of systems are constantly interacting: APIs, databases, third-party services, and front-end code. As modern application environments scale, one question becomes unavoidable: how do you know what’s really happening across the system? And how do you spot issues early, before they impact users and revenue?
That’s where observability comes in. It helps you understand system behavior from the outside in, using telemetry to detect anomalies, investigate incidents, and diagnose root causes faster. In a world where a few seconds of friction can cost a customer, observability is no longer optional. It’s a strategic capability.
Summary
1.
Definition: observability explained simply
2.
Observability and monitoring: a complementary relationship
3.
Why observability is essential today?
4.
The pillars of observability
5.
How observability data is generated
6.
Key components of an observability approach
7.
Observability in practice: issues and challenges
8
The concrete benefits of observability
9.
Who is affected by observability?
10.
Observability, a strategic investment
Observability is the ability to understand what’s happening inside a system by analyzing the signals it produces. In practice, it means you can explain anomalies in your applications and services, including issues you did not predict in advance. Why is this page slow for a subset of users? Which dependency is causing errors? Where is latency introduced along a request path?
More than a toolset, observability is a mindset and an operating model. It relies on collecting telemetry (logs, metrics, and traces), correlating those signals, and turning them into answers teams can act on. A truly observable system is one you can query and troubleshoot effectively, even when the failure mode is new or unexpected.
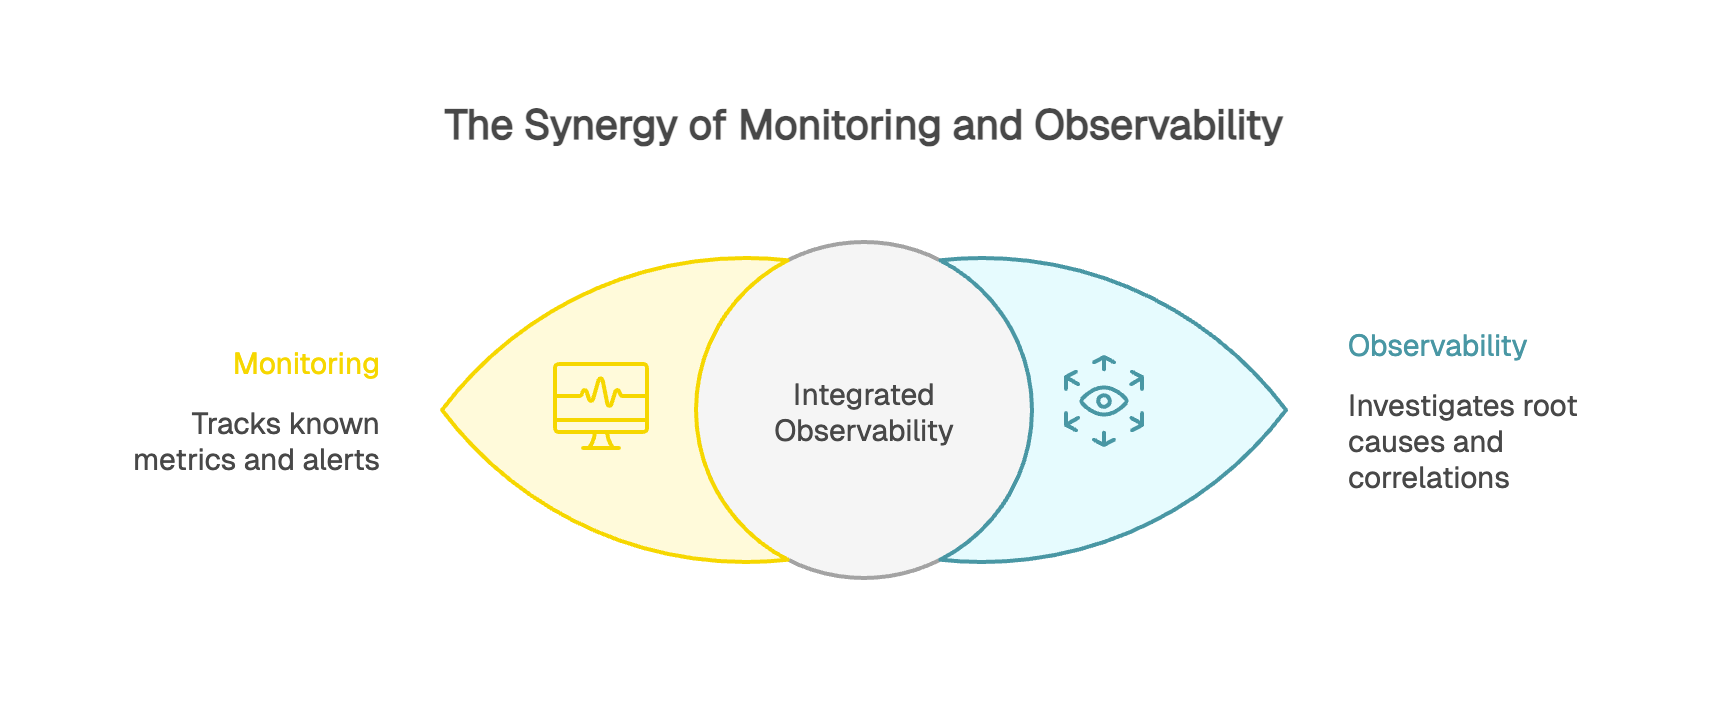
Observability and monitoring are often confused, but they’re not opposites. Monitoring is one of the foundations of observability.
Monitoring answers “what happened” and “when.” It tracks known metrics and triggers alerts when predefined thresholds are crossed. Did your error rate spike above 5%? Monitoring pages the team. It’s like a car dashboard warning light telling you something is off.
Observability helps you answer “why is this happening” and “where should I look next.” It lets you investigate more deeply by correlating signals across logs, metrics, and traces and drilling down to the root cause. In the car analogy, it’s the diagnostic tooling that tells you whether the engine is overheating because of a coolant leak, a failed fan, or a clogged radiator.
At Kapptivate, we support this observability workflow end-to-end. We combine monitoring and alerting with the contextual data teams need to investigate faster and make complex environments truly observable.
Modern web applications are complex ecosystems. A single payment flow can depend on authentication, a banking gateway, inventory, shipping, and customer data, all working together in real time.
User experience is now a strategic differentiator. It directly shapes satisfaction, retention, and brand trust. A form that takes three extra seconds to respond or a page that breaks on mobile creates friction that pushes customers to abandon. When performance degrades, the business impact shows up quickly in drop-offs and lost revenue.
Observability matters most when you’re dealing with “unknown unknowns”, the issues you cannot predict ahead of time. How do you anticipate that a minor update to a JavaScript dependency will slow down interactions only for a specific segment, like Android users on a particular Chrome version? With observability, teams can detect and explain anomalies even when no alert was configured for that exact scenario.
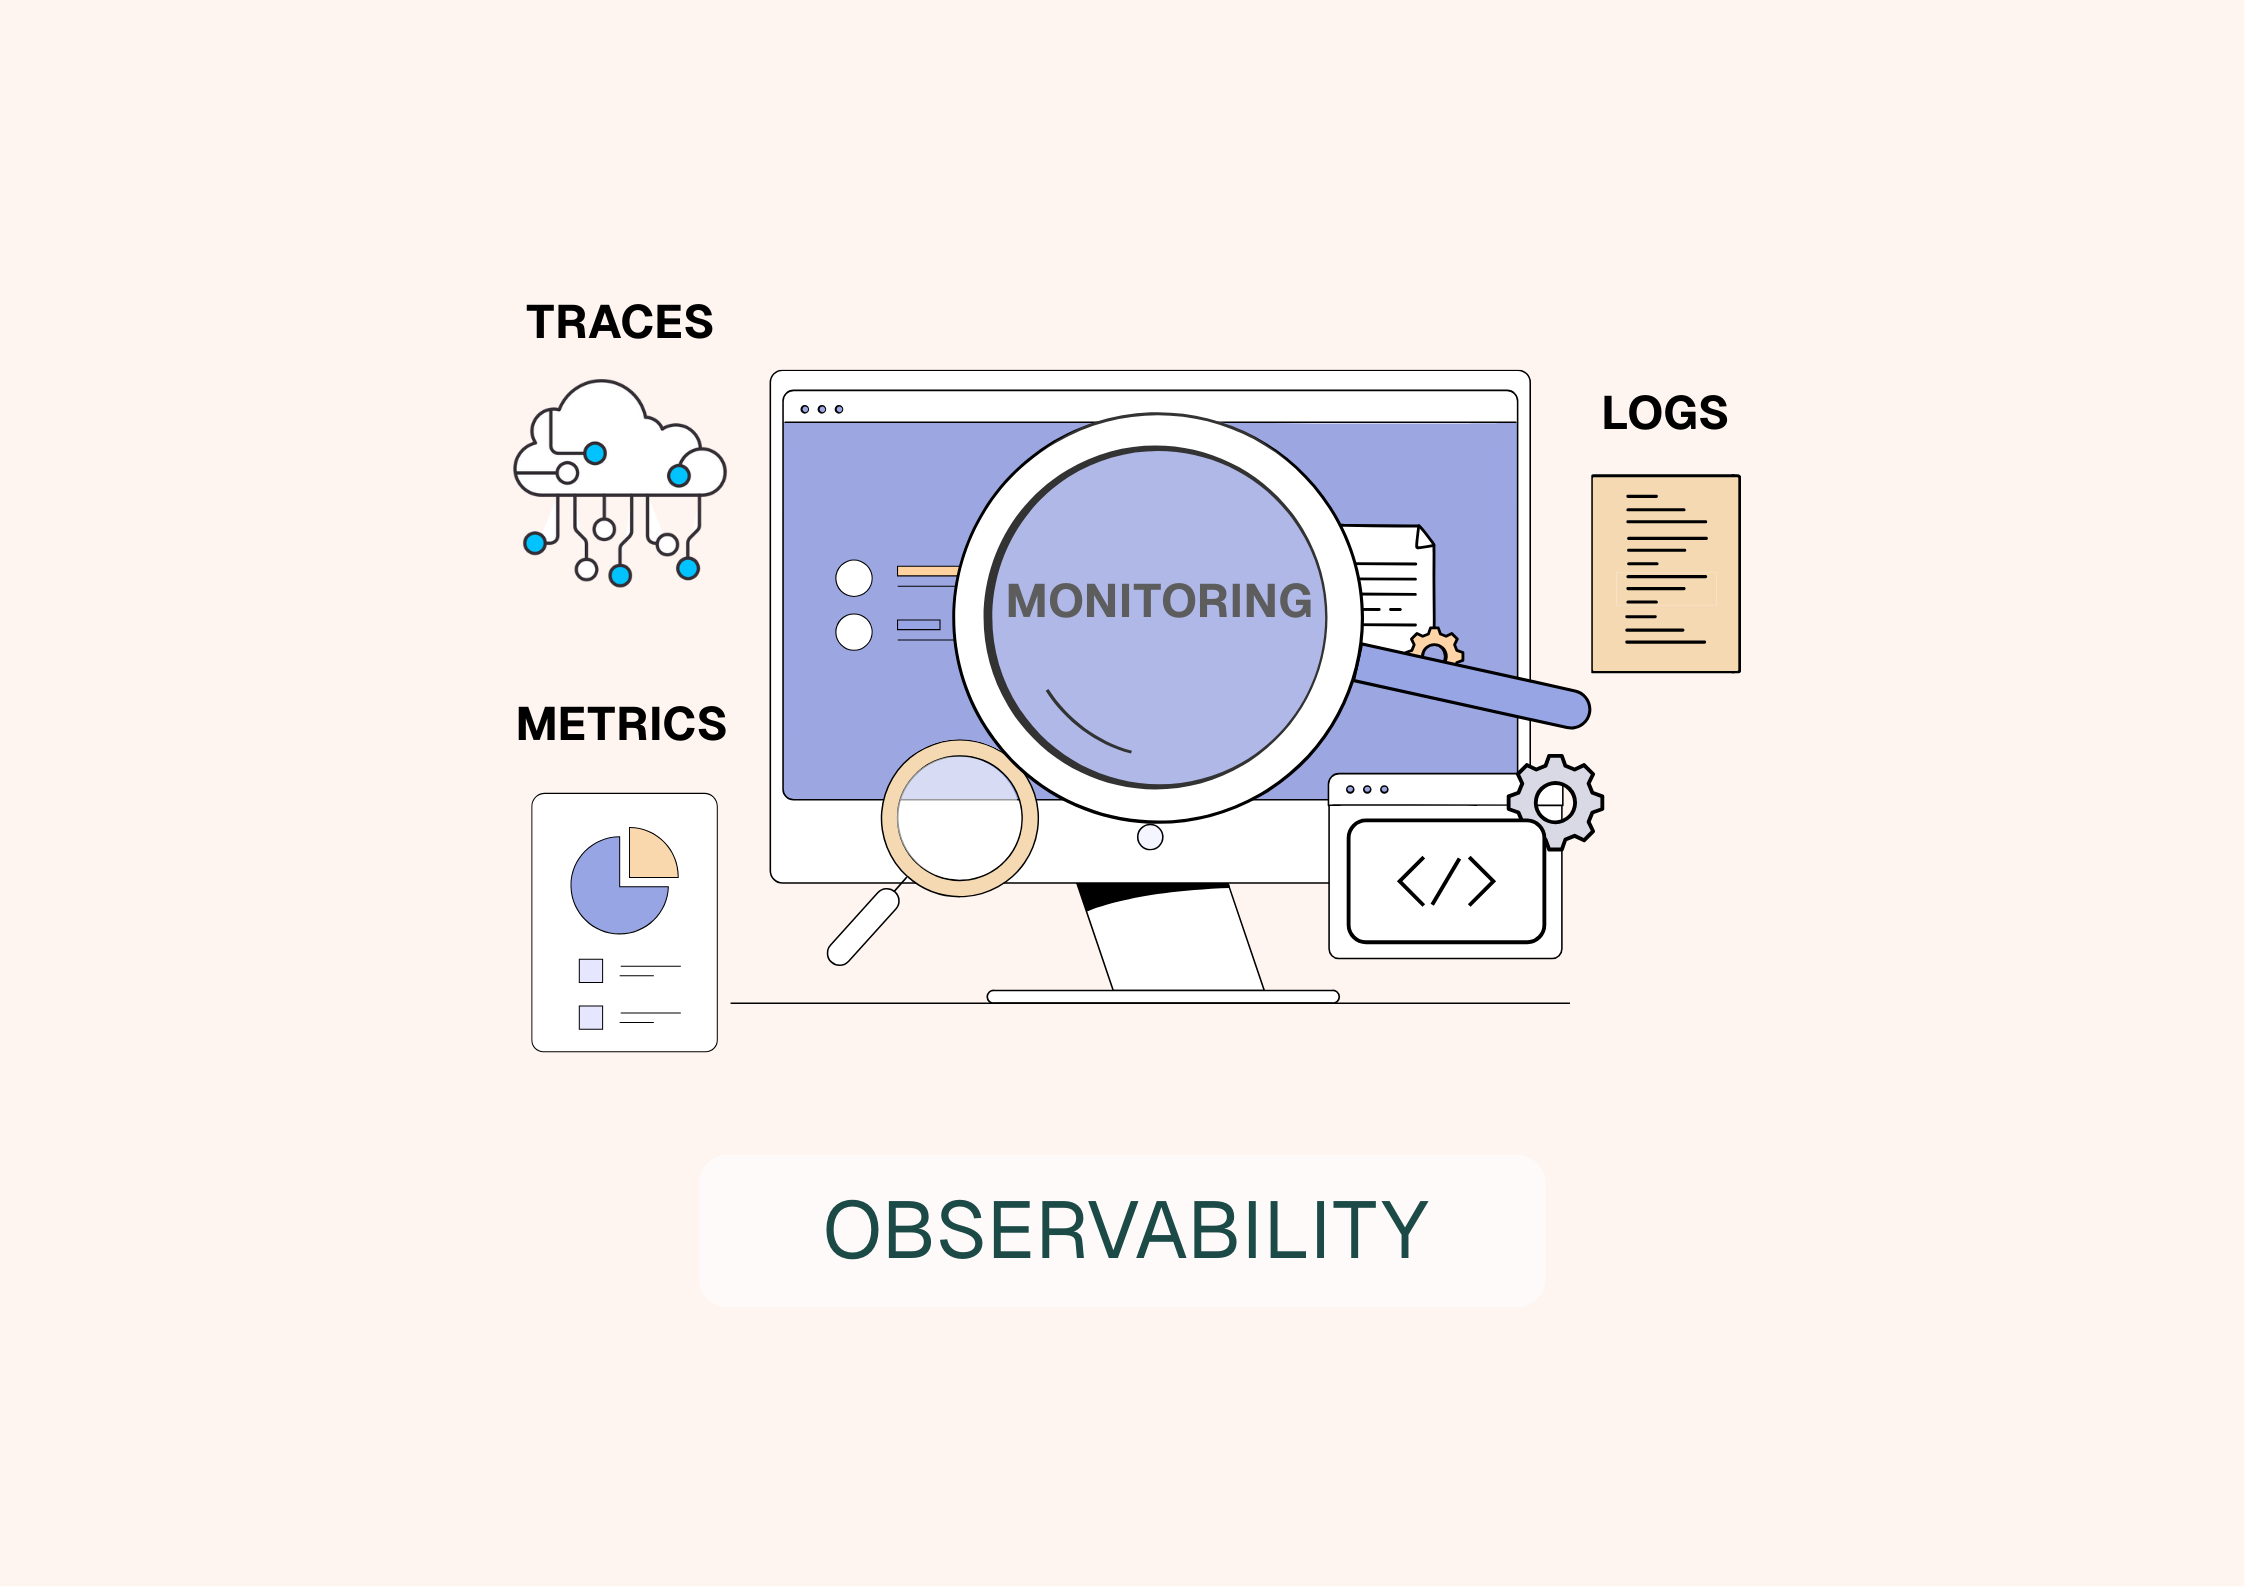
Observability relies on four core types of telemetry that help you understand system behavior. This is often summarized as the MELT model: Metrics, Events, Logs, and Traces.
Metrics are quantitative indicators of performance and health: average response time, requests per second, error rate, conversion rate, CPU usage, memory consumption, and more. Because metrics are aggregated, they provide a fast, cost-effective, high-level view of what the system is doing at a given moment. They’re typically the first signal you use for dashboards and alerting.
Events capture discrete, meaningful changes or actions in your environment: a deployment, a configuration update, a feature flag change, a server restart, or a critical user action. Events are most useful when they’re structured and enriched with metadata (who, what, when, where), so teams can correlate performance shifts with what changed.
Logs are timestamped records that provide detailed context about what happened. They capture messages, errors, and application or system activity at the moment it occurred. For example: a user authenticated at 2:37 p.m., browsed several pages, then hit an error during checkout at 2:42 p.m. Logs help you reconstruct sequences, validate hypotheses, and debug issues with precision.
Traces show the end-to-end path of a request as it travels through services and dependencies. Distributed tracing breaks a transaction into spans, measures latency at each step, and helps you pinpoint bottlenecks across the full request lifecycle. Traces work by propagating a trace ID (and span IDs) across components so every part of the request can be tied back to the same transaction.
Having logs, metrics, and traces isn’t enough on its own. The real value of observability comes from correlating those signals to isolate the root cause.
An alert fires: front-end load time is up 40% over the last hour. You start correlating data. API logs show rising response times. Traces indicate the slowdown concentrates around database calls. Infrastructure metrics show a CPU spike on the database host. The likely cause: an inefficient SQL query introduced in the latest deployment.
Without correlation, teams can waste hours searching in the wrong place. Observability changes troubleshooting from guesswork into a guided investigation: instead of hunting blindly, you follow a breadcrumb trail to the point of failure.
A raw metric has limited value without context. Saying average load time is 2.5 seconds is a start. Knowing it’s 1.8 seconds in France, 3.2 seconds in the United States, and 4.5 seconds in APAC is far more actionable.
That context comes from dimensions (also called tags or attributes). Dimensions answer the who, what, where, and when, letting you segment data by browser, region, app version, device type, and user cohort.
This level of granularity has real business impact. Is cart abandonment rising? Dimensional analysis might show the issue affects only iPhone users on iOS 17, and only when paying with Apple Pay. That precision lets you narrow the investigation quickly and communicate clearly with impacted users while the fix is in progress.
Now that we’ve covered the four telemetry types, the next step is understanding which tools help you put them to work. Instrumented applications emit these signals, and observability platforms collect and analyze them, turning raw telemetry into a system-wide view.
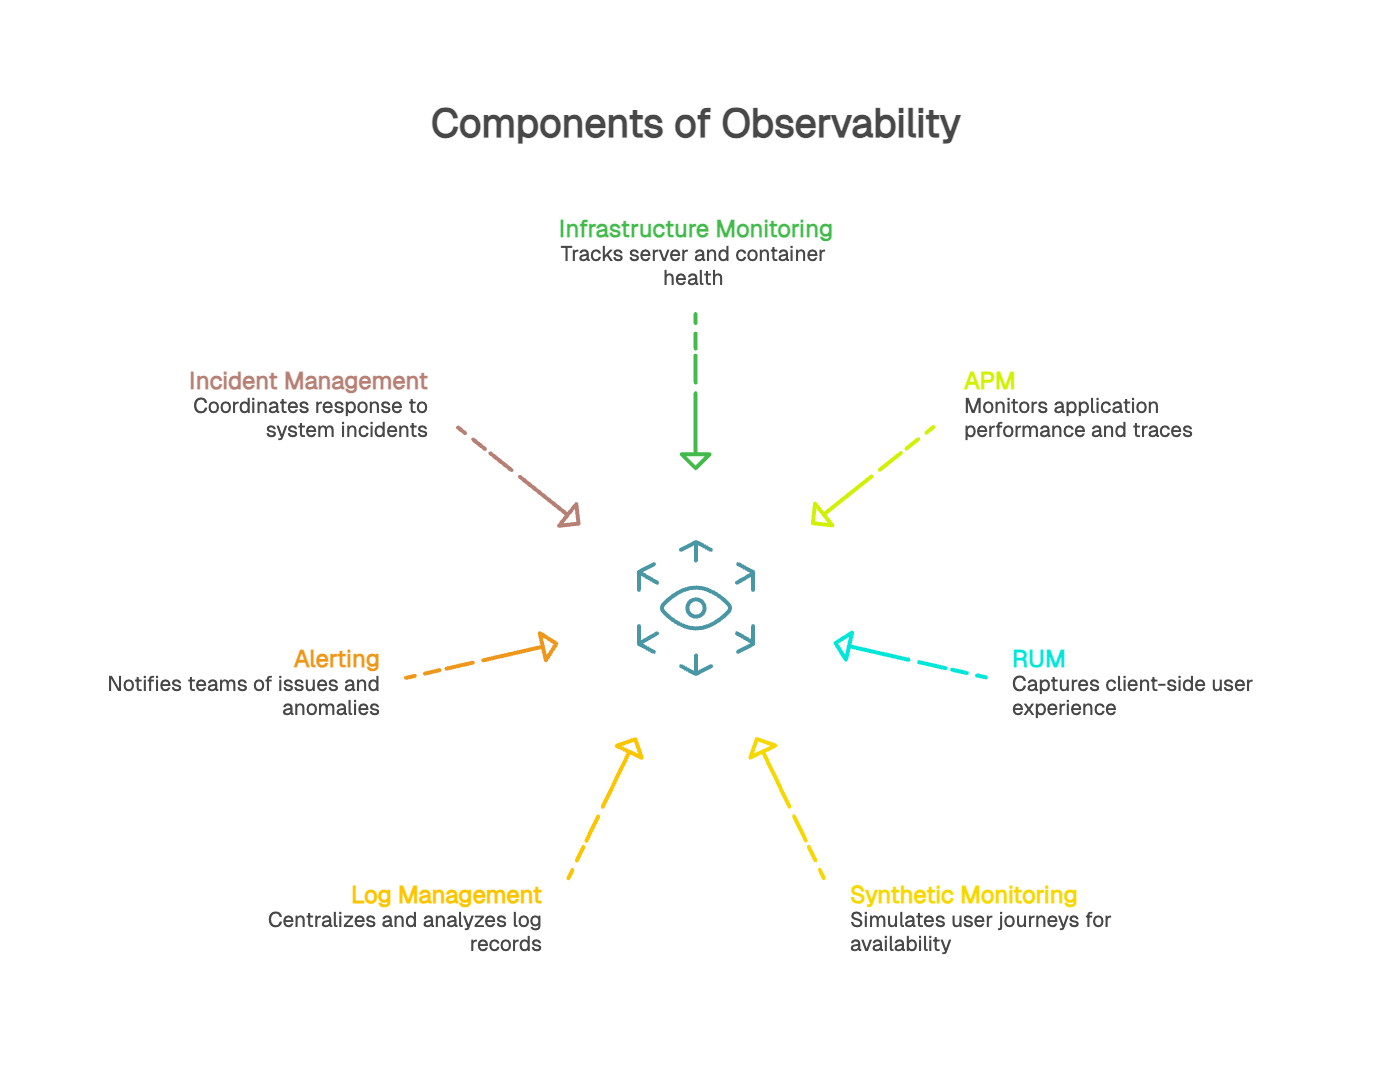
Infrastructure monitoring primarily produces system metrics and events tied to status or configuration changes.
APM collects distributed traces from application instrumentation, along with performance metrics (latency, throughput, error rate) and often application logs.
RUM captures client-side signals from the browser, including load timing, Core Web Vitals, JavaScript errors, and resource performance for CSS, JS, and images.
Synthetic monitoring runs automated journeys and produces availability and performance metrics, screenshots, and pass/fail results for each step.
This mix of sources is exactly what makes correlation so valuable. By connecting infrastructure metrics with application traces, deployment events, and client-side session signals, you get a comprehensive view of what’s happening across the stack.
That power multiplies when telemetry is standardized through OpenTelemetry and trace context is propagated automatically across services. This is what turns “a pile of metrics” into real observability: the ability to explore production behavior, ask new questions, and debug unknown issues without rewriting and redeploying code.
An observability strategy relies on multiple, complementary signal sources. Each one provides a different perspective on how a system behaves in production.
Infrastructure monitoring tracks the health and performance of servers, containers, databases, and runtime environments. It primarily produces system metrics (CPU, memory, disk I/O, and network latency) along with events tied to state changes. These signals help detect issues affecting underlying resources.
APM uses application instrumentation to follow request execution end to end. It provides application metrics (latency, throughput, error rate), distributed traces broken into spans, and often deployment markers or release events. APM helps teams pinpoint where a request slows down and understand service behavior under real production conditions.
RUM captures client-side signals from the browser: load timing, Web Vitals, JavaScript errors, render blocking resources, and variations by device, browser, or region. This data reflects how users actually experience performance across different contexts.
Synthetic monitoring runs predefined journeys on a schedule to measure availability and performance in a controlled environment. It provides a stable baseline for validating critical paths, measuring the impact of changes, and proactively catching issues even when traffic is low.
Log management centralizes, structures, and analyzes log records generated by services across the stack. Logs provide the detail needed to explain patterns seen in metrics or traces and to confirm root-cause hypotheses during investigations.
Alerting uses metrics, traces, and events to notify teams when thresholds are breached or anomalies are detected. Incident management brings relevant context together (logs, metrics, traces, change timelines, and ownership) to speed resolution and support clear internal and external communication.
Observability delivers its full value when instrumentation allows metrics, logs, traces, and events to be connected within the same context. Correlation accelerates diagnosis, reduces time to resolution, and builds a clearer understanding of system behavior.
Modern web applications can generate millions of telemetry records per day. That volume quickly raises hard questions about collection, storage, and compute costs. This is where intelligent sampling and tiered retention become essential. For example, you might retain 100% of error traces but only 1% of successful traces, or keep detailed logs for 7 days and then store only aggregates for 90 days.
Cardinality is the number of unique combinations your dimensions can produce. With three dimensions (endpoint, region, HTTP status code) and 50 endpoints, 10 regions, and 20 codes, you end up with 10,000 distinct time series. As cardinality grows, storage and query costs can spike, dashboards get noisy, and systems struggle to keep up.
Finding the right balance between granularity and practicality requires discipline. Do you really need a unique user ID as a dimension, or is it enough to segment by user cohort (new vs returning, plan tier, device type) to answer the business question?
GDPR requires careful handling of user data. The goal is to collect enough signal to understand experience without compromising privacy. In practice, that often means anonymization and pseudonymization. Instead of storing a full email address, store a hashed identifier. Instead of logging the full IP address, store a coarse location such as country or region.
Some data should never be logged: passwords, credit card numbers, authentication tokens, or health data. Automated data classification and masking should reduce the risk of accidental exposure.
Start with what matters most. Which user journeys are critical to the business: checkout, account creation, search, or authentication? Focus instrumentation on these high-impact flows first.
Instrument intentionally. Capture signals that map to real questions, not everything that happens to be available. And keep in mind: building an observability culture matters as much as the tools. Train engineers, encourage product managers to define success criteria in measurable terms, and involve support teams so customer pain shows up as actionable telemetry.
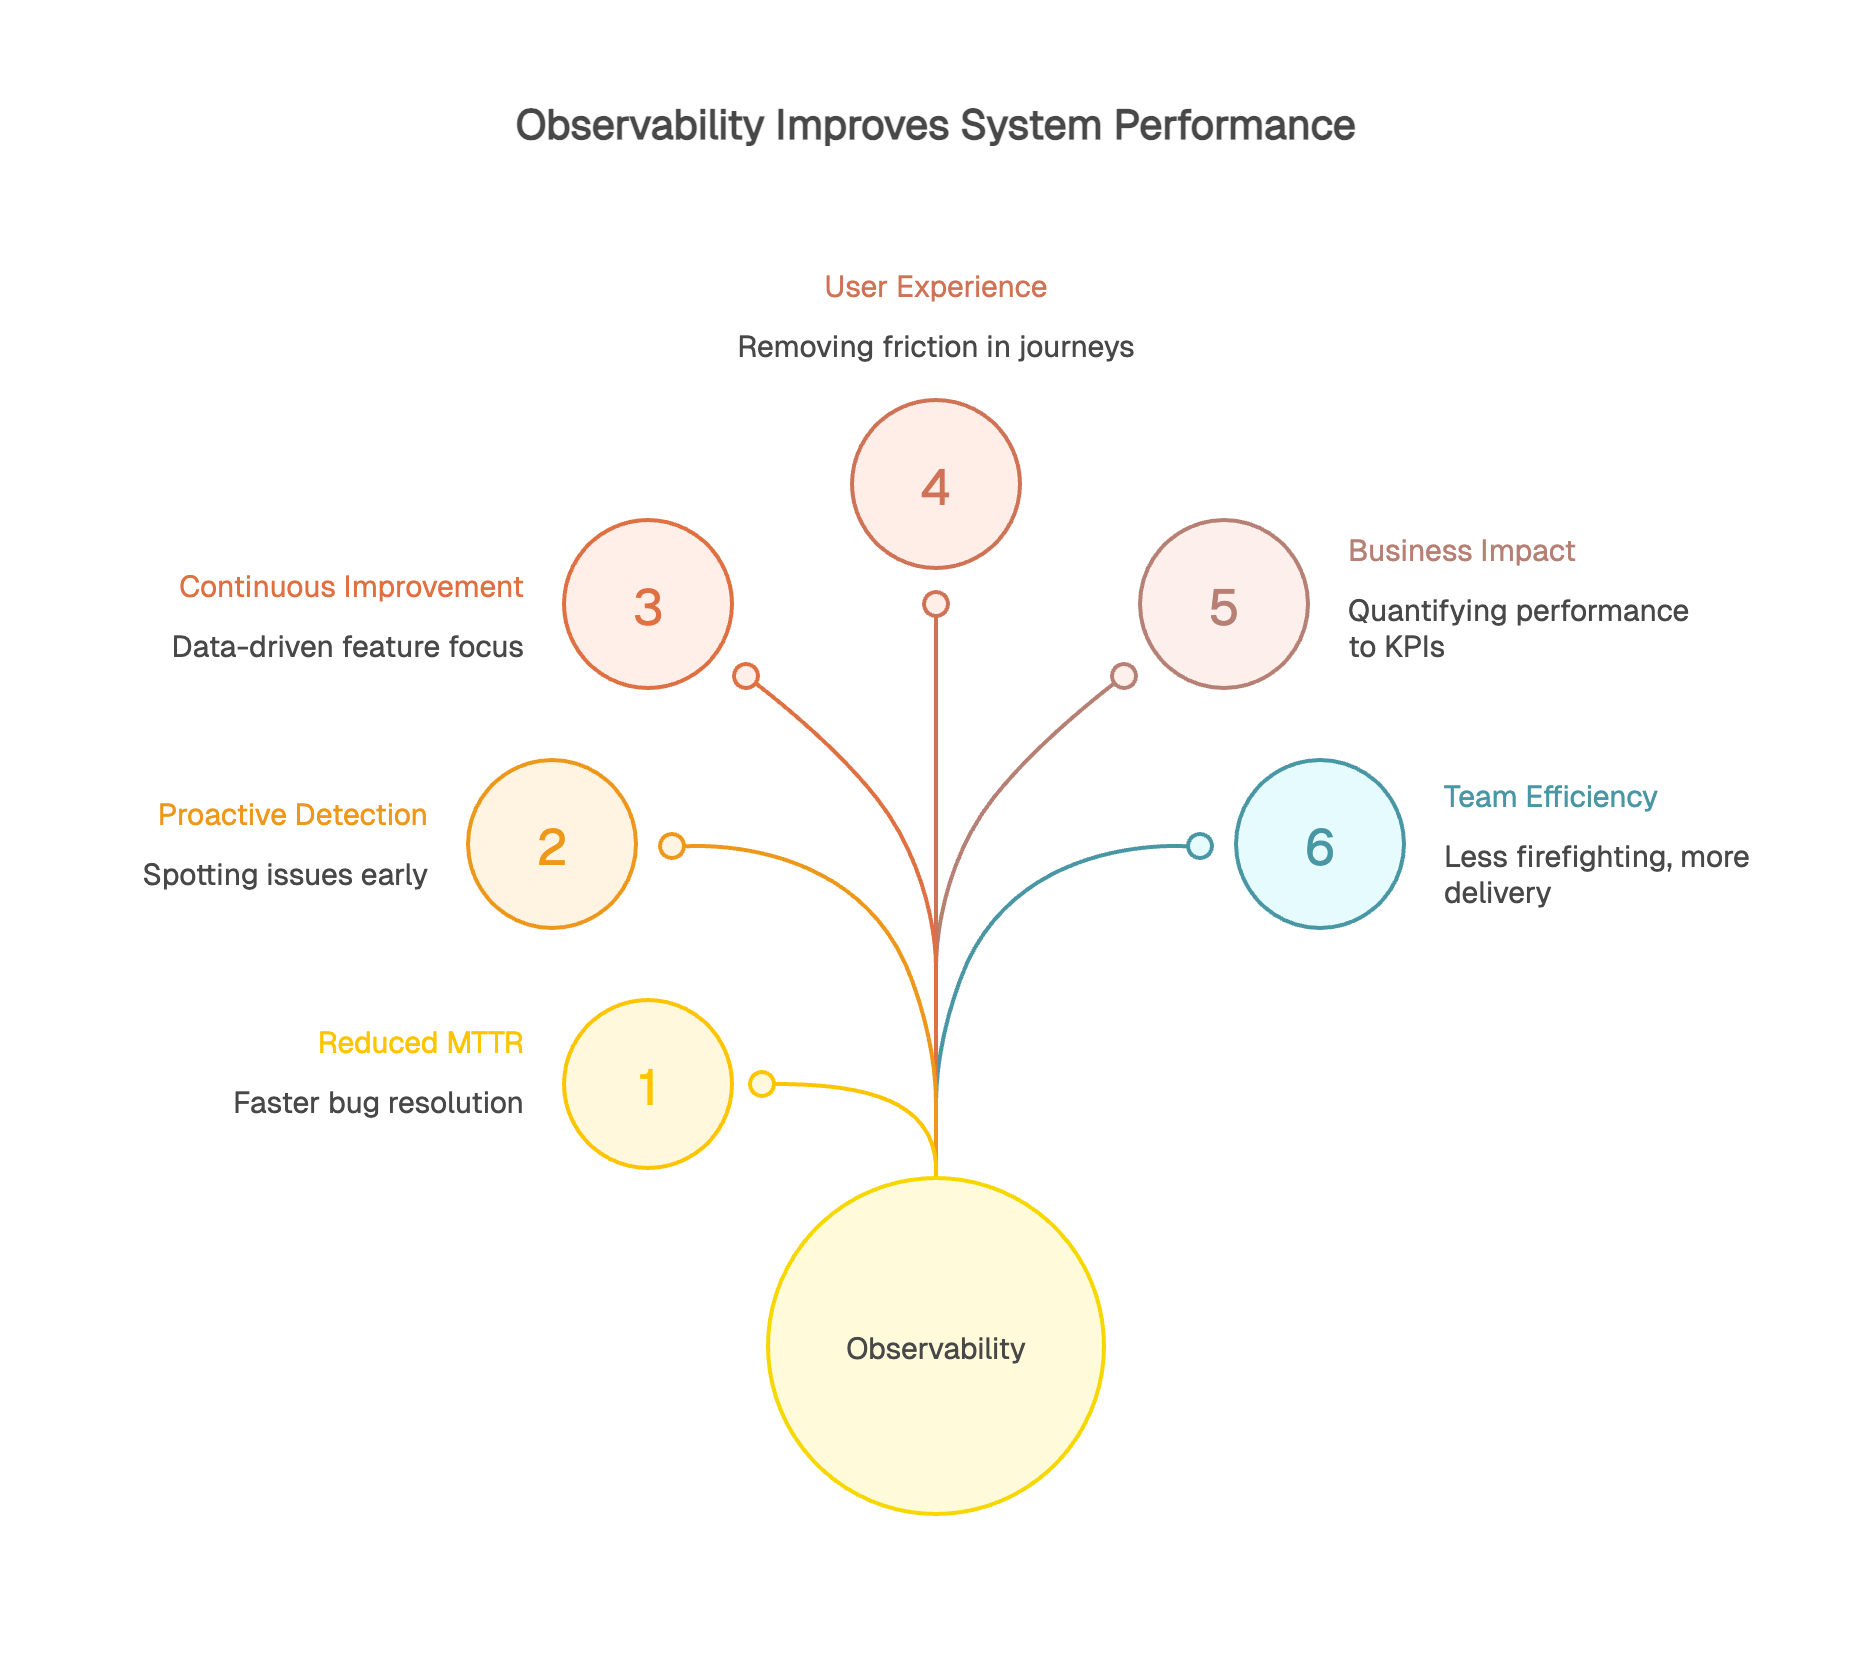
Strong observability practices can materially reduce MTTR (Mean Time to Resolution). Instead of spending hours trying to reproduce a bug, teams can jump straight into the production traces and logs that capture the failure as it happened. Faster root-cause isolation means faster fixes, fewer repeat incidents, and less time lost to guesswork.
Proactive detection is a game changer. You can spot anomalies before users notice them: gradual degradation, rising error rates, or latency creeping up in a critical dependency. Observability helps teams detect these weak signals early, before they turn into major incidents.
Observability also supports continuous improvement. Real usage data shows where to focus effort. Is a feature actually being used? Did a refactor improve performance or just move the problem? Telemetry provides objective answers.
User-focused observability helps teams find and remove friction in key journeys. Seeing a 30% drop-off at step two of a form is useful. Understanding that this step takes 5 seconds to load on mobile but only 1 second on desktop is actionable.
It also helps you validate impact after changes ship. If you optimize a product page, you can confirm whether load time improved and whether user outcomes improved as well, such as fewer drop-offs or higher completion rates. This makes prioritization easier: invest where user impact is highest.
Observability creates a bridge between system performance and business KPIs. It helps quantify how slowdowns affect conversion and revenue: how many abandoned carts correlate with an extra second of load time, and what that means in dollars.
ROI is often straightforward: less downtime protects revenue, better experience improves retention, and targeted optimization ensures engineering effort goes where it matters most. For many organizations, even a few minutes of downtime can cost thousands to millions depending on traffic and transaction volume, so reducing MTTR from 30 minutes to 5 minutes can be a meaningful win.
Observability changes day-to-day engineering work. Less constant firefighting, more time for planned delivery and continuous improvement. With proactive detection and effective diagnostics, developers can focus on building value instead of chasing symptoms.
Collaboration improves as well. When teams share the same source of truth, conversations get more productive. Instead of debating ownership in circles, objective data clarifies what changed, where the impact is, and what to fix next.
Observability isn’t just for DevOps or SRE teams. It creates value across the organization.
Developers use it to debug faster and optimize applications. Product managers use it to understand how the product is actually used: which features, by whom, and how often.
Customer support can anticipate issues and resolve them faster, sometimes before a customer even reports a problem. Leadership gains visibility into the health of the digital business, including availability, performance trends, and the revenue impact of incidents.
Observability creates a shared language across teams. Objective data replaces opinion-based debates. “The site is slow” becomes “Load time increased by 20% on mobile in France between 2 p.m. and 4 p.m. for iOS 17 users.”
That level of precision drives alignment. Developers know where to investigate, product managers can assess user impact, and support teams can communicate with customers using accurate, consistent information. Observability democratizes system visibility and supports a culture of shared ownership for service quality.
In a world where digital reliability is non-negotiable, being able to understand what’s happening inside your systems matters. Observability isn’t a luxury reserved for hyperscale tech companies. It’s a practical requirement for any organization that runs digital services.
Getting started doesn’t require reinventing everything. Identify your critical journeys, roll out instrumentation and tooling in phases, and build a culture that treats data as a shared asset. The benefits tend to show up fast: fewer incidents, better user experience, more efficient teams, and measurable business impact.
The real question is no longer whether you need observability, but how to implement it effectively. The first step is to assess where you are today: do you have the data to explain system behavior in production? Can you answer critical questions quickly when something breaks? If not, it’s time to close the gap.
Given how many observability tools exist, a fair question is, where do you start? For many teams, synthetic monitoring is the simplest entry point.
Unlike RUM, which requires adding a client-side snippet or SDK to collect real-user data, or APM, which typically requires deeper application instrumentation, synthetic monitoring can be rolled out with minimal changes to your stack. You define scripted journeys that mirror critical paths, and those tests run automatically, 24/7, from multiple locations.
That simplicity helps you get value fast. Synthetic monitoring runs continuously and can detect issues before real users hit them. If a third-party API starts slowing down at 3 a.m., you get alerted immediately, shifting your posture from reactive to proactive.
Synthetic monitoring also gives you a controlled, repeatable test environment. You can establish stable benchmarks, measure the impact of releases with confidence, and validate critical but low-frequency scenarios. It’s also a strong fit for monitoring staging or pre-production environments with the same rigor as production.
At Kapptivate, we focus on synthetic monitoring because it’s one of the most accessible gateways to observability. Our platform helps you configure monitoring scenarios across critical journeys quickly, with predictable effort and measurable results in the first few weeks.

