.svg)

.svg)


Testing
TESTING

Automated testing to validate user experiences across real devices, networks, and channels.
Features
CHANNELS
Automated testing to validate user experiences across real devices, networks, and channels.
Real User Monitoring (RUM) measures digital performance using data collected from real user sessions. It captures what users actually experience while browsing a website or using an application, across different devices, browsers, and network conditions. The result is a high-fidelity view of production performance and user experience, grounded in real traffic rather than lab assumptions.
Summary
1.
Technical functioning of RUM
2.
RUM vs Synthetic Monitoring: comparative analysis
3.
Ecosystem and integration with modern tools
4.
Putting data into practice and leveraging it
5.
Root cause analysis
6.
Use cases and best practices
7.
Conclusion
8
9.
10.
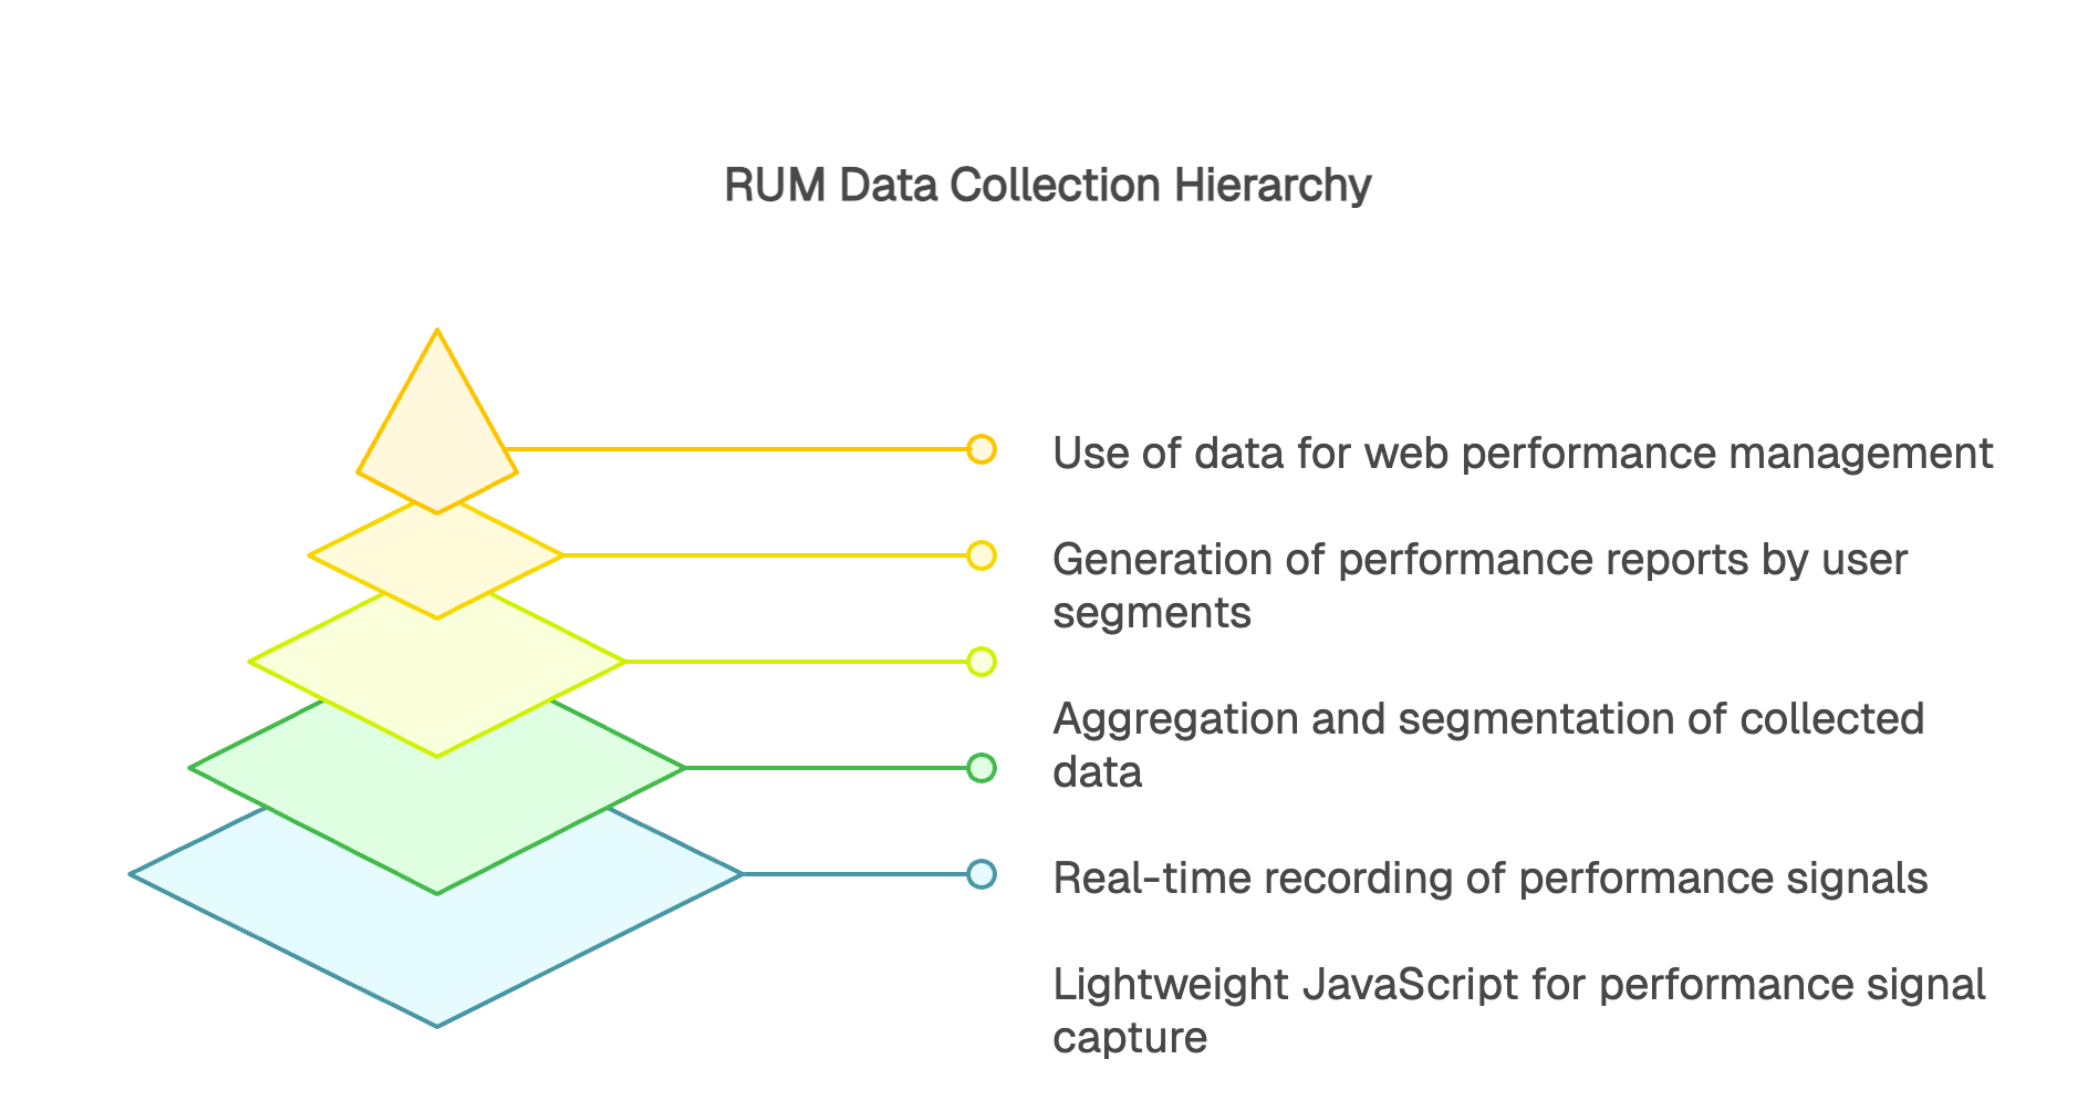
The client-side JavaScript snippet sits at the core of a RUM setup. This lightweight script is typically added in the page <head> and loads asynchronously to minimize impact on page performance. It leverages modern browser performance APIs to capture key signals around resource loading, rendering, and user interactions.
Data collection usually follows a simple flow. The script initializes as the page starts loading and begins recording performance signals. As users interact and navigate, it captures metrics, timing data, and interaction events in real time. At defined moments (for example, after page load, on route changes, or on key user actions), the data is batched and sent securely to a backend pipeline. From there, it’s processed and aggregated into reports segmented by region, device, browser, and operating system.
Real User Monitoring captures a wide range of performance signals, not just a handful of standardized metrics. Load and render timing shows how quickly pages and key visual elements appear for users. Responsiveness signals measure the delay between an interaction (click, tap, scroll, or keystroke) and visible feedback, which is a strong proxy for perceived smoothness. Visual stability data highlights unexpected layout shifts that disrupt navigation and degrade the user experience.
Network timing is another core layer. Metrics such as Time to First Byte (TTFB) reflect server responsiveness, while DNS lookup time, TCP connect time, and TLS handshake time can materially influence start-up performance. These technical measurements become far more useful when enriched with context like device type, browser version, operating system, and user region.
Together, technical and contextual data show exactly when performance degrades, where it happens, and which users are affected. That’s what makes RUM so valuable: it reflects real-world experience across messy, variable conditions that controlled tests cannot fully replicate. With the right analysis, this data turns monitoring into an operational tool for web performance management and user journey optimization.
Real User Monitoring has limitations that come from relying on real traffic. The biggest constraint is volume: without visitors, you don’t get data. That makes it difficult to monitor low-traffic pages or validate new features before a public release. Sampling can also reduce precision and representativeness, especially when teams downsample sessions to control overhead and cost.
Some signals only appear after users actually trigger them, which limits early detection. For example, client-side JavaScript performance or an API call’s latency only becomes measurable once a user action initiates that work. As a result, there can be a delay between a problem emerging in production and it showing up clearly in your RUM data.
Implementing Real User Monitoring requires careful alignment with GDPR data protection requirements. While RUM is primarily focused on technical performance signals, some data elements such as IP addresses, device identifiers, and certain session IDs can qualify as personal data if they enable direct or indirect identification.
Best practice is to apply data minimization and privacy-by-design controls: truncate or mask IP addresses, pseudonymize technical identifiers, exclude sensitive content, and filter or redact any fields that could identify a user. If you can truly anonymize the dataset and use it strictly for performance measurement, compliance becomes significantly easier. When anonymization isn’t possible, organizations typically rely on an appropriate lawful basis and safeguards, which often involves a legitimate interest assessment (purpose, necessity, and balancing) and clear transparency to users.
Organizations should also document processing activities, define retention periods, and ensure that non-anonymized data can be handled in line with GDPR rights (access, deletion, objection, etc.). A compliant RUM architecture usually combines strong governance (policies, documentation, retention) with technical protections (masking, access controls, and secure transport) so performance visibility doesn’t come at the expense of privacy.
Real User Monitoring (RUM) measures performance using telemetry collected from real user sessions in the browser, giving you a high-fidelity view of experience in production. Synthetic monitoring runs scripted journeys from controlled locations on a schedule, helping teams detect issues proactively, often before users notice.
The differences matter. RUM depends on real traffic and typically requires privacy controls and governance when collecting browser-side data (for example, handling IP addresses or session identifiers). Synthetic monitoring does not depend on visitors because it uses test agents, and it generally avoids user-consent complexity because it does not collect data from real users. RUM is especially good at revealing issues that affect specific user segments (device, browser, network, region), while synthetic monitoring provides consistent 24/7 coverage of the journeys you choose to test, with fast alerting when something breaks.
The two approaches are complementary. RUM shows how users actually experience performance and helps prioritize optimizations based on real impact. Synthetic monitoring validates critical paths continuously and flags regressions early. Together, they form a complete monitoring strategy: synthetic monitoring anticipates and alerts, while RUM confirms and quantifies user impact.
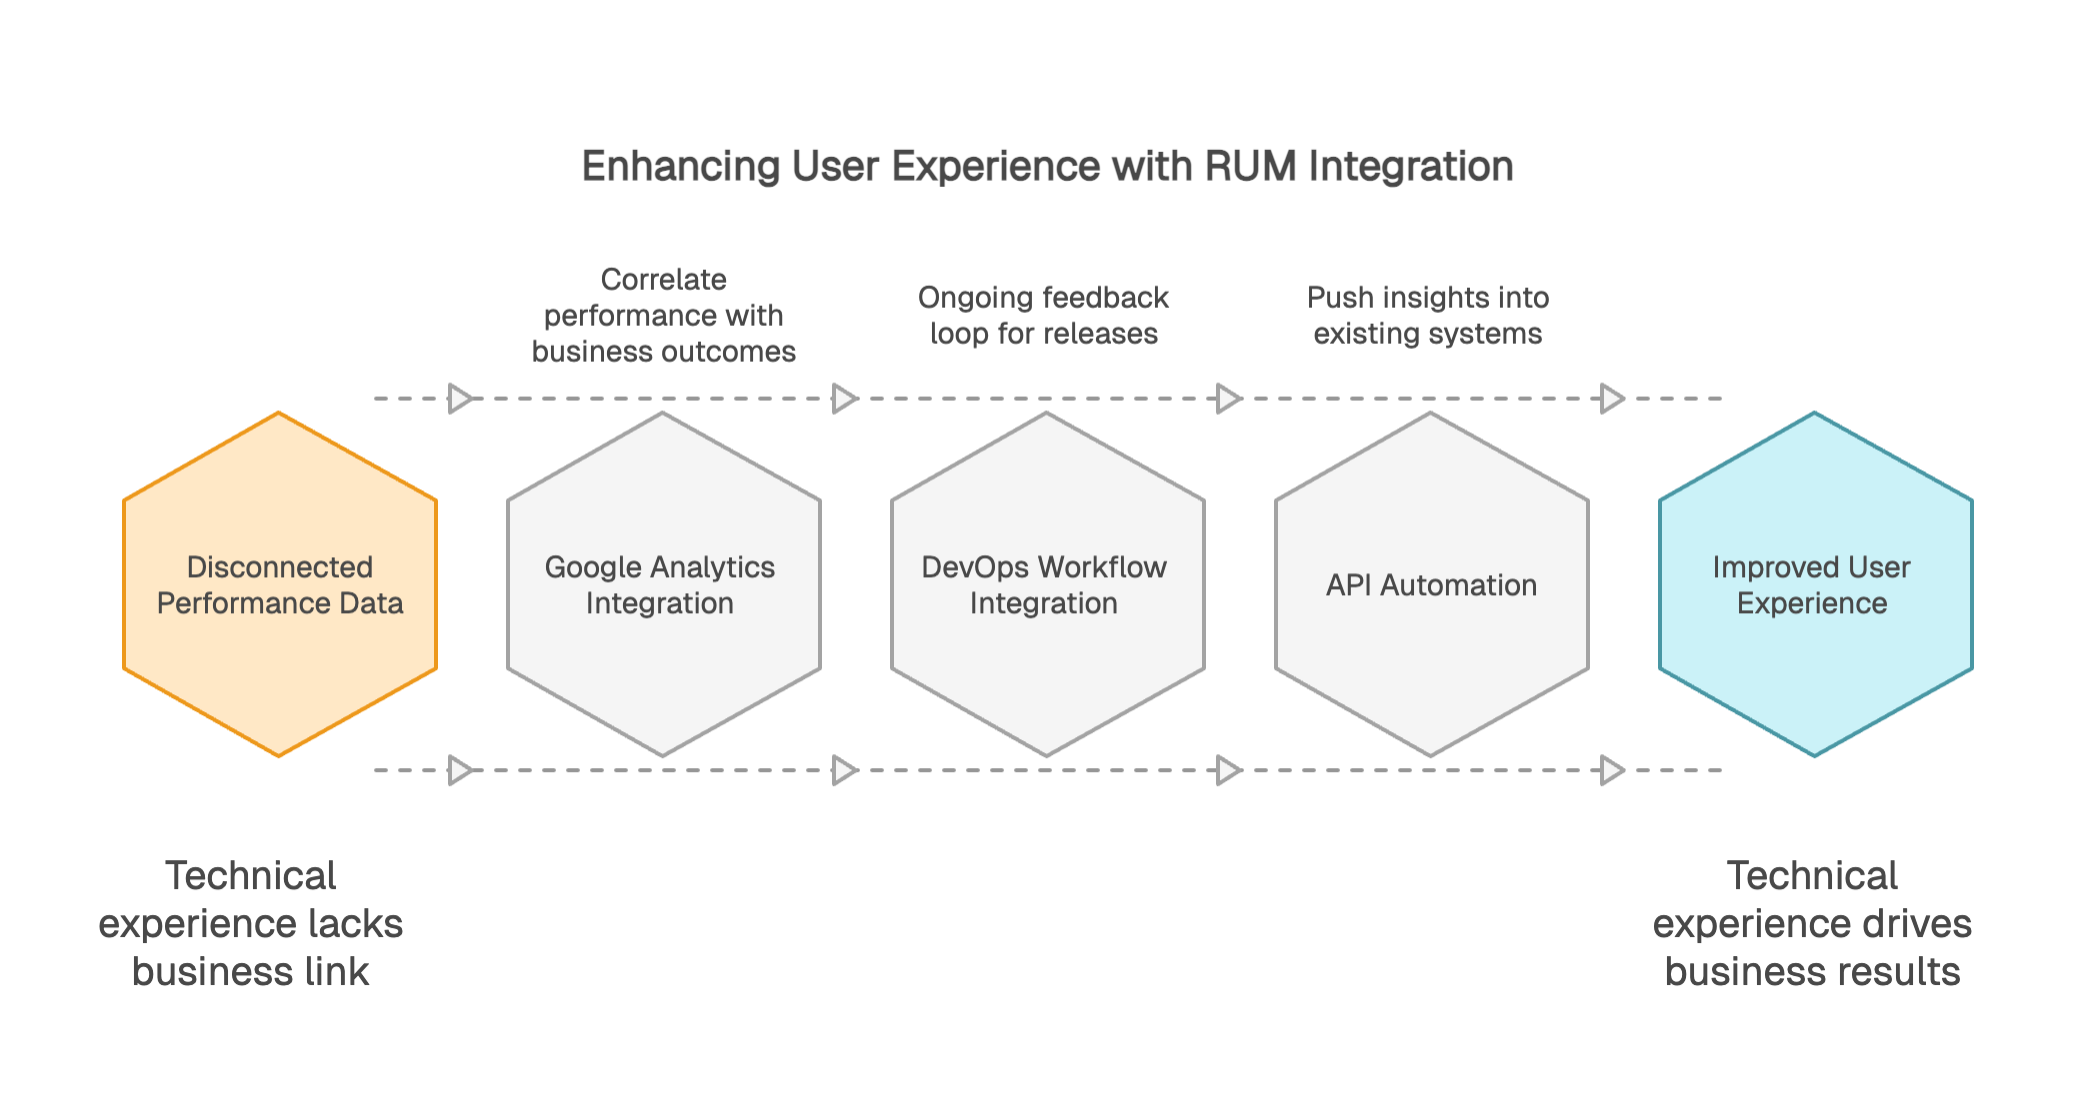
Integrating RUM with Google Analytics 4 lets you correlate performance signals with business outcomes, creating a clearer link between technical experience and results. This makes it easier to see how changes in load and responsiveness influence conversion rate, engagement, and funnel completion.
Bringing RUM into DevOps workflows turns it into an ongoing feedback loop. Teams can measure the impact of each release on real user performance, detect regressions quickly, and validate whether optimizations actually improved the experience in production. Alerts based on RUM thresholds also improve responsiveness when user-facing performance degrades.
Most modern platforms expose REST APIs (and webhooks) to automate RUM data collection and analysis, making it straightforward to push insights into existing dashboards, CI/CD reporting, and alerting systems.
Your monitoring strategy should align with clear business objectives. For an e-commerce site, product page speed and checkout flow smoothness are critical. For a SaaS application, interaction responsiveness and UI stability matter most, with close attention to API latency and client-side performance.
Combining RUM data with synthetic tests often reveals the most useful insights. If a regression shows up only in RUM, it may point to conditions that synthetic tests don’t fully capture, such as a specific region, ISP, device class, or browser version. If an issue appears only in synthetic monitoring, it can indicate an early warning: a problem emerging in production that hasn’t yet affected real users at scale, or a failure limited to the scripted journey or test location.
Root cause analysis uses the depth of telemetry to narrow down what’s driving performance issues. Segmenting audiences helps you identify whether a regression affects specific regions, browsers, or device types. That level of detail often surfaces issues you would not catch in lab tests, such as a degraded CDN edge in one geography, a browser-specific compatibility problem, or poor performance for users on slower networks like 3G.
Correlating performance trends with releases and infrastructure changes makes it easier to connect cause and effect. Many modern platforms automatically annotate performance charts with deployment markers, config changes, and incidents, so the impact of each change is visible at a glance. This traceability speeds up resolution, reduces back-and-forth, and improves collaboration between engineering and operations teams.
Real User Monitoring gives teams a clear view of performance as it’s experienced in real user sessions. By capturing a wide range of contexts, devices, and network conditions, it shows how experience varies across real-world usage, not just in ideal test environments.
This field data helps teams track changes in perceived performance over time, validate the impact of releases, and make decisions based on what users actually encounter day to day.
In that sense, RUM is a strong complement to synthetic monitoring, which relies on controlled, repeatable scenarios to watch critical journeys continuously. Used together, the two approaches provide fuller coverage and make it easier to explain why performance varies: synthetic highlights early warnings and validates key paths, while RUM confirms the real user impact and uncovers segment-specific issues.
As architectures grow more complex and user expectations keep rising, this combination helps maintain a high-quality experience and prioritize improvements with confidence.
Real User Monitoring measures the web performance actually perceived by users. Its ability to capture the real user experience, in all its complexity and diversity, provides insights that would otherwise be impossible to obtain. A deep understanding of the performance experienced by users effectively guides technical and business decisions, transforming data into a competitive advantage.
The combined mastery of RUM and Synthetic Monitoring forms a comprehensive monitoring system, cross-referencing real usage data with controlled tests on critical paths. This hybrid approach enables companies to guarantee an optimal user experience.
The continuous evolution of web technologies and user expectations makes real-world performance monitoring more crucial than ever. Organisations that adopt a data-driven approach based on RUM empower themselves to improve user satisfaction, preserve their brand image, and optimise the productivity of their internal teams by quickly identifying issues that need to be resolved. This approach allows them to remain competitive in an ever-changing digital environment.