.svg)

.svg)


Testing
TESTING

Automated testing to validate user experiences across real devices, networks, and channels.
Features
CHANNELS
Automated testing to validate user experiences across real devices, networks, and channels.
OpenTelemetry (often shortened to OTel) is an open-source project that provides a standard way to generate, collect, and export observability telemetry: traces, metrics, and logs. Its core goal is to make telemetry data consistent and interoperable, so teams can instrument services once and route that data wherever they need, without rewriting instrumentation every time they change tooling.
Hosted by the Cloud Native Computing Foundation (CNCF), OpenTelemetry has become a widely adopted foundation for telemetry in cloud-native environments. It offers vendor-neutral APIs, SDKs, and collectors that let you capture signals in a consistent format and send them to any compatible observability platform. For modern organizations, adopting OpenTelemetry is a strategic move: it reduces vendor lock-in, improves portability, and sets you up to scale observability as architectures and requirements evolve.
Summary
1.
Understanding telemetry data
2.
A brief history of OpenTelemetry
3.
How OpenTelemetry works
4.
Main components of OpenTelemetry
5.
Benefits of OpenTelemetry
6.
CI/CD observability use cases
7.
Glossary of OpenTelemetry terms
8
Is OpenTelemetry a standard?
9.
Examples of telemetry data
10.
What is the OTLP protocol and why is it important?
Telemetry data is the foundation of modern observability because it provides three complementary views of system behavior: logs, metrics, and traces. Each signal answers a different type of question, and together they give teams a much deeper understanding of reliability, performance, and overall service health.
Logs are timestamped records of discrete events. A typical log entry might capture a login attempt with a timestamp, a request or session ID, and an outcome (success or failure). Logs are essential for deep troubleshooting, debugging, and validating what code actually did in production.
Metrics are numeric measurements over time, usually stored as time series. Examples include CPU utilization at 85% or throughput of 1,200 HTTP requests per second. Metrics work well for dashboards, alerting, and long-term trend analysis because they’re lightweight and easy to aggregate.
Traces show the end-to-end path of a request or transaction as it moves through a distributed system, broken down into spans. For example, a checkout flow spanning multiple microservices can be traced across services and dependencies. The trace makes bottlenecks visible and shows where latency is introduced across the request lifecycle.
Before OpenTelemetry, the ecosystem was split across two CNCF projects with similar goals but different approaches. OpenTracing focused on vendor-neutral APIs for distributed tracing, emphasizing abstraction and portability. OpenCensus, meanwhile, provided language-specific libraries to collect traces and metrics, offering a more end-to-end approach at the cost of additional complexity.
That fragmentation created real friction for teams and vendors, from duplicated effort to incompatible instrumentation choices. To unify the landscape, the CNCF brought the projects together under a single initiative: OpenTelemetry.
The result is more than a simple merge. OTel combines standardized APIs, production-ready SDKs, built-in and auto-instrumentation options, and the OpenTelemetry Collector for processing and exporting telemetry. Over time, it has become a widely adopted standard foundation for modern observability.
OpenTelemetry provides a standardized telemetry pipeline: it helps you generate, collect, process, and export logs, metrics, and traces, then route them to the observability backend of your choice. The architecture is intentionally vendor-neutral and extensible, so it can fit everything from a single service to large distributed environments.
At a high level:
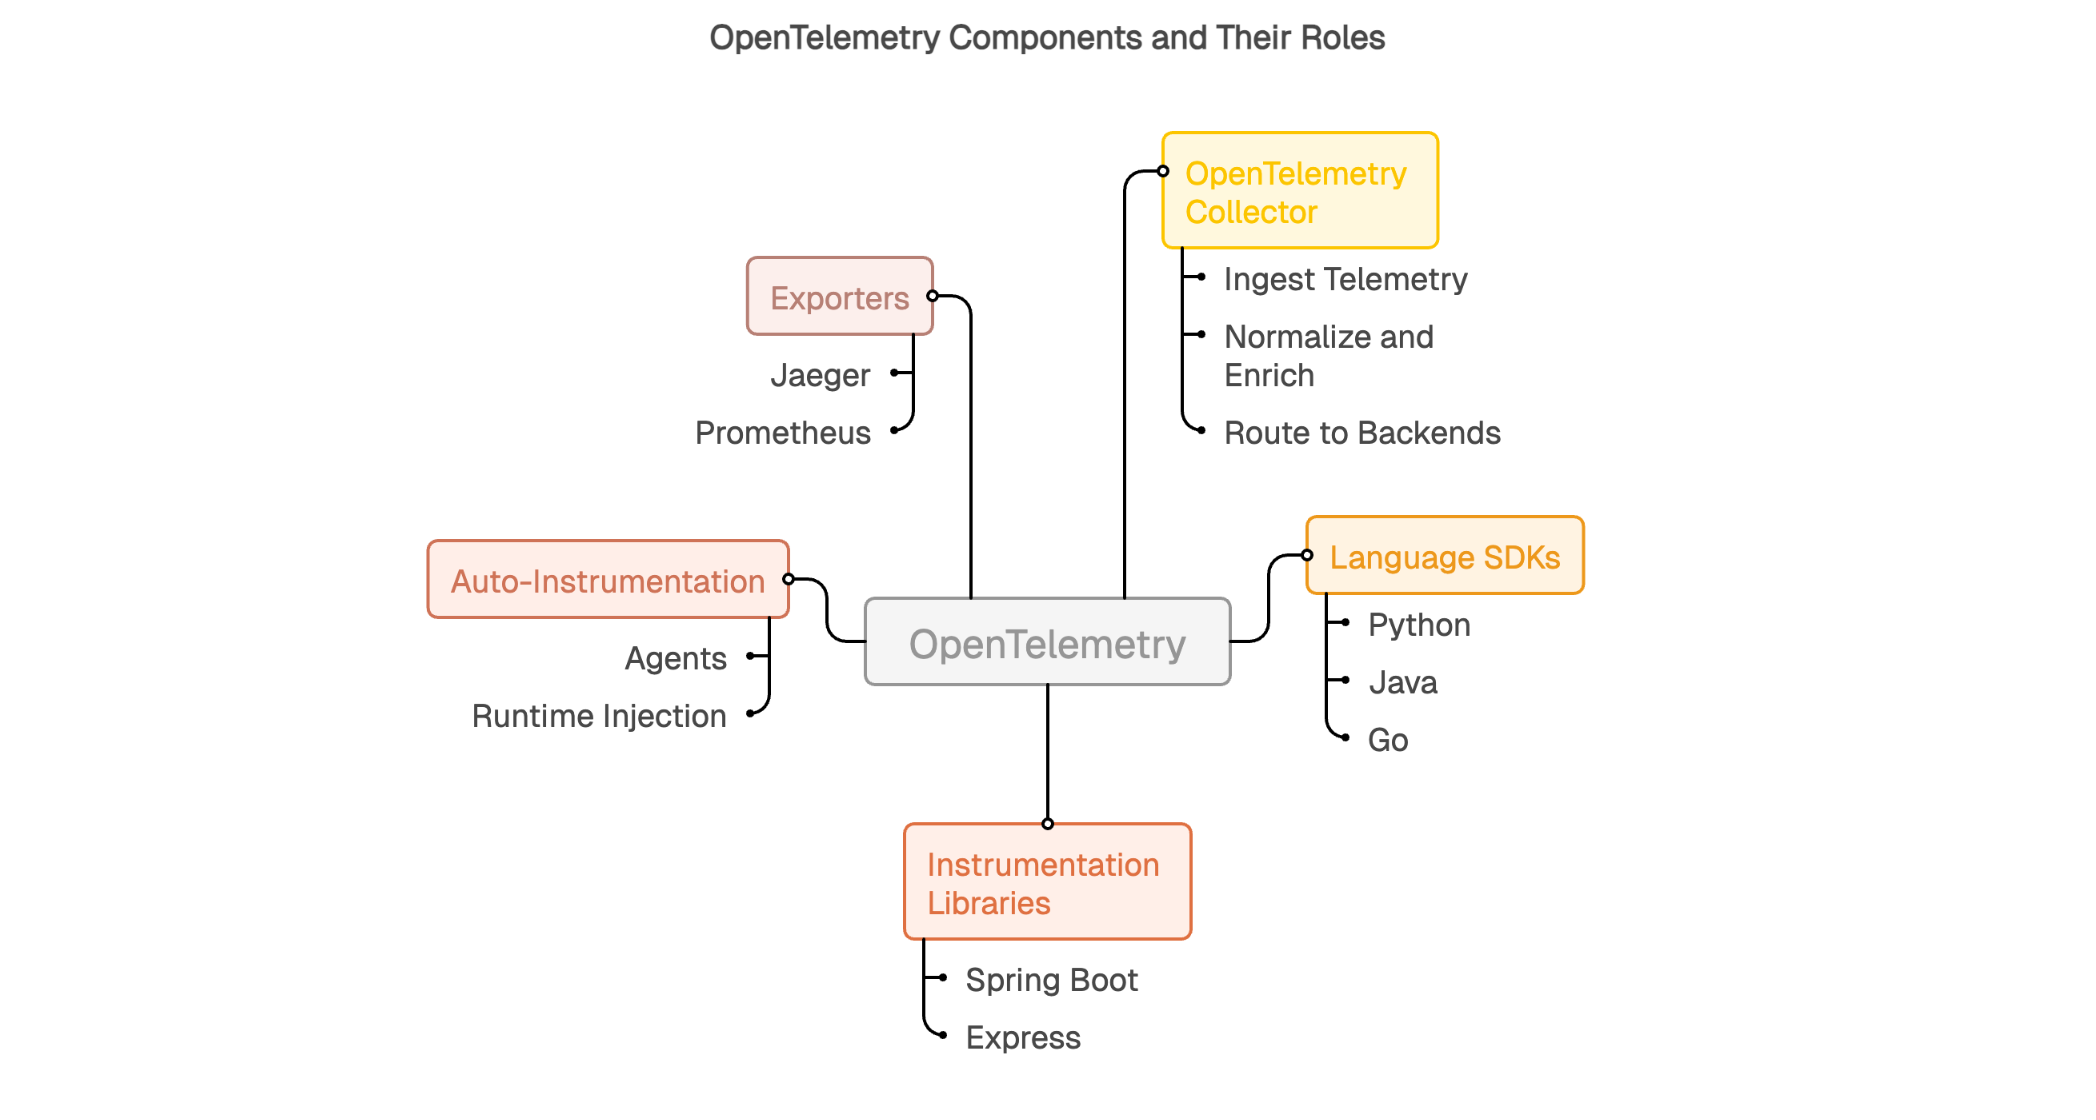
OpenTelemetry’s strength comes from its modular building blocks, which combine to form a flexible observability pipeline. Each component plays a specific role in how telemetry is generated, processed, and delivered.
This modular architecture creates a clean separation of concerns. Each component can evolve independently while preserving interoperability, which lets teams scale and adapt observability over time without rebuilding everything whenever the stack changes.
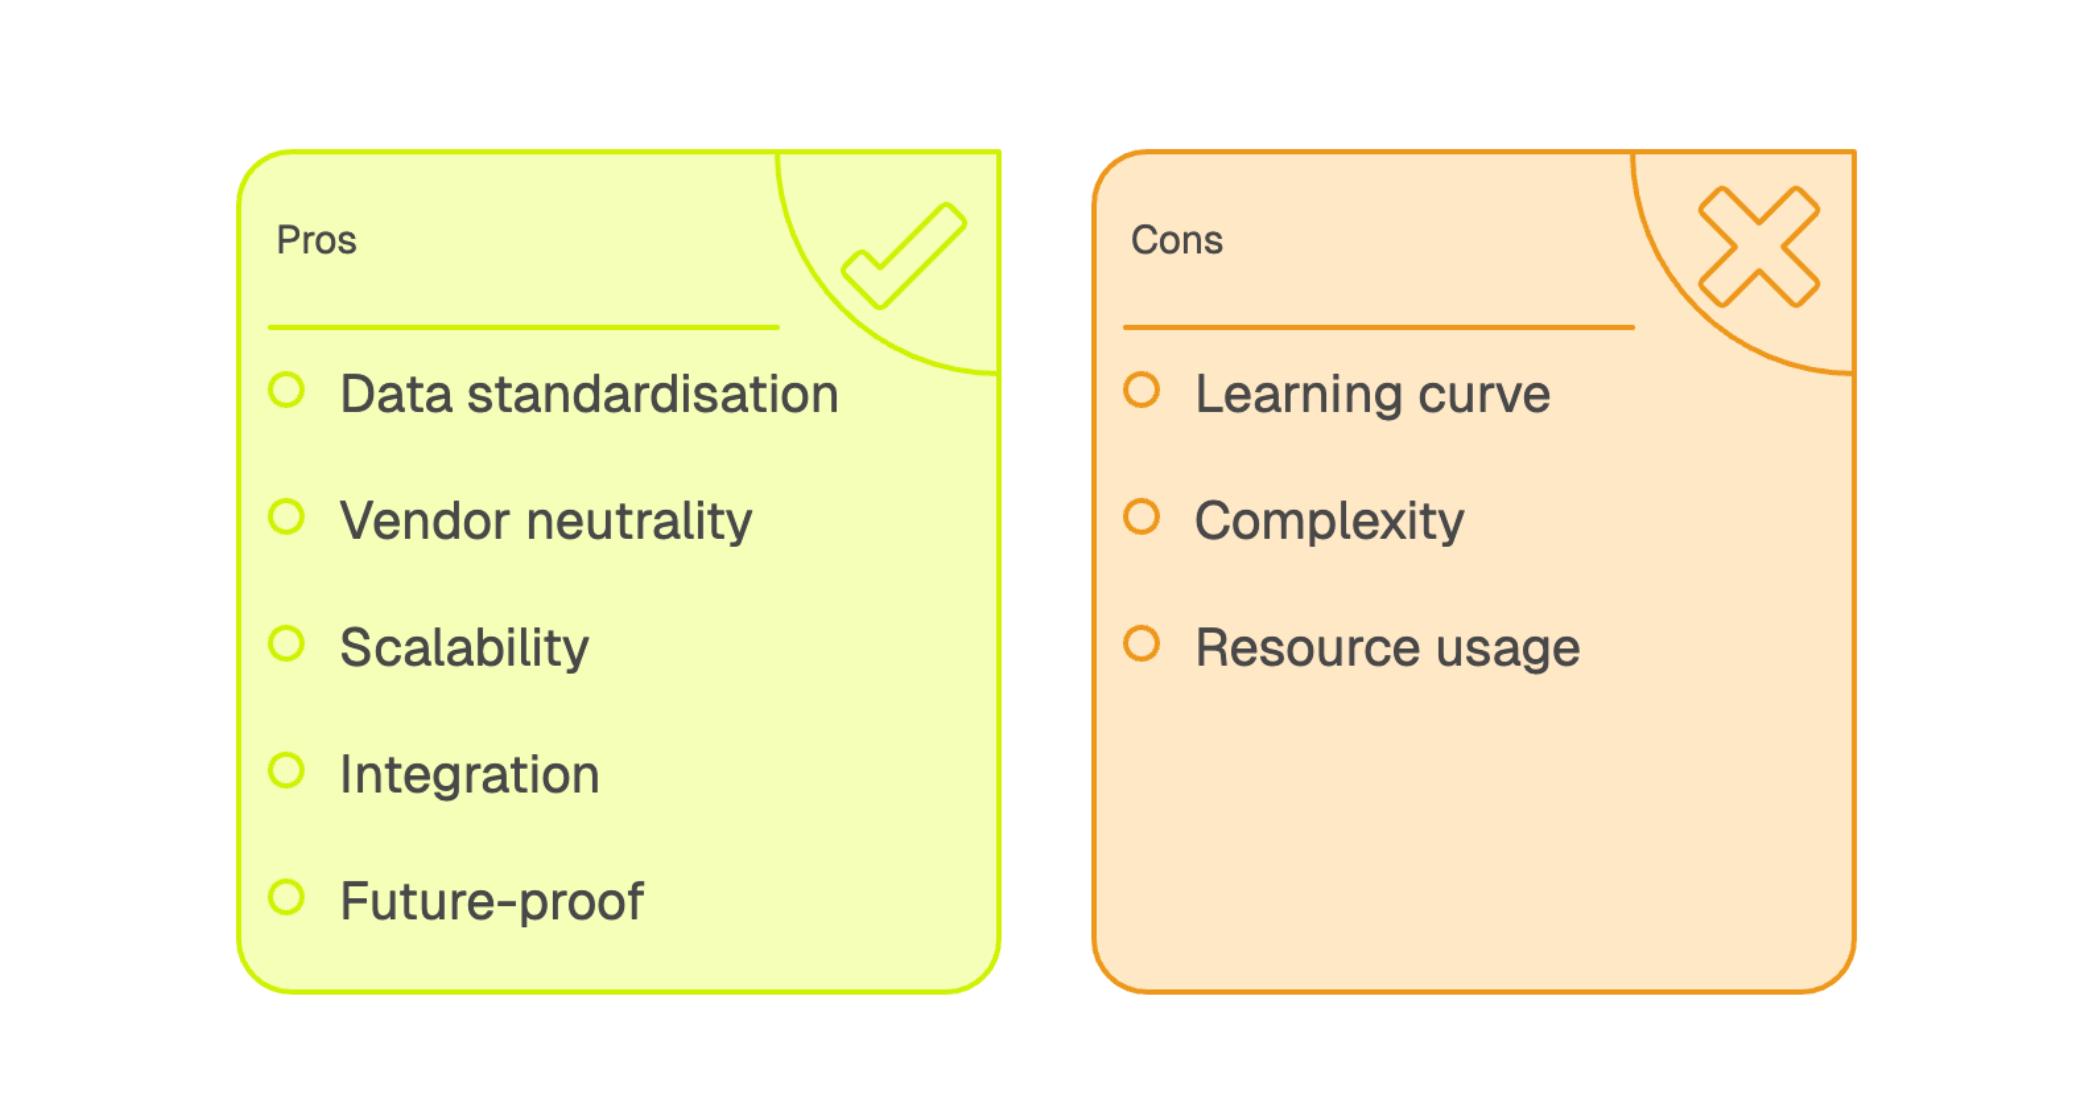
Adopting OpenTelemetry can deliver practical benefits: more consistent observability, simpler operations, and better long-term flexibility. At the core of its value is standardization and portability.
Standardization is the first major benefit. You instrument once using a common approach and can send telemetry to multiple backends, including systems like Prometheus, Jaeger, and Grafana, or any platform that supports OTLP. This reduces integration sprawl by giving teams a consistent way to generate and export logs, metrics, and traces, even when architectures and tooling vary.
Vendor neutrality changes how you manage observability tooling. Because instrumentation is decoupled from the backend, you can switch platforms or add new tools without re-instrumenting every application. That makes it easier to evolve your stack over time and protects your investment as requirements change.
Consistency also improves analysis. With a common semantic foundation and standardized transport, it becomes easier to correlate signals across services and run more advanced analytics in your backend, from richer querying to automated detection and, where appropriate, machine learning workflows. The key advantage is that data from different teams and runtimes arrives in a more uniform shape, making it easier to operate at scale.
Finally, OpenTelemetry is designed to scale with modern systems. It supports diverse languages and platforms, integrates well with existing monitoring and observability tools, and provides a future-proof foundation for organizations that expect their architecture and tooling to keep evolving.
CI/CD pipelines can also benefit from OpenTelemetry, especially when you want visibility into the build and release process itself. In practice, tools like Jenkins, GitHub Actions runners, or custom build scripts can emit telemetry, metrics, logs, and sometimes traces, using OpenTelemetry conventions or exporters.
Once pipeline telemetry is captured, you can correlate it with application and infrastructure data to get a more complete view of the software delivery lifecycle. In an observability backend, this makes it easier to track build duration, spot bottlenecks, connect test failures to environment changes, and detect abnormal behavior like flaky steps or sudden regressions in execution time. For DevOps teams, the payoff is straightforward: data-driven pipeline optimization, shorter cycle times, and more reliable deployments.
OTLP (OpenTelemetry Protocol) is a vendor-neutral protocol used to transmit telemetry between OpenTelemetry components (SDKs, Collectors) and observability backends. Its optimized design supports efficient export of traces, metrics, and logs in a consistent format.
API (Application Programming Interface) defines how instrumentation records telemetry in a given language. It provides the contract between your application code and the OpenTelemetry SDK, including how context is attached and propagated.
Collector is a vendor-neutral service that receives telemetry, processes it (filtering, transforming, enriching), and routes it to one or more destinations. It acts as a centralized pipeline for standardizing export across teams and environments.
Distributed tracing tracks requests across multiple services in a distributed system, showing how a transaction flows through dependencies and where time is spent.
Instrumentation is how telemetry gets generated. It can be automatic (agents or libraries that capture common signals) or manual (custom spans, metrics, and events tied to business logic).
Span is a single timed operation within a trace. It records start and end timestamps, attributes (metadata), and context, and may link to child spans.
Logs are timestamped records of events or states observed in a system. They’re often structured (key/value fields) to support search, filtering, and correlation.
Trace is the full end-to-end view of a request, composed of related spans that represent the complete path of a transaction across services.
OpenTelemetry is an open-source project that provides a unified approach to collecting and exporting logs, traces, and metrics. Backed by the Cloud Native Computing Foundation (CNCF), it benefits from open, vendor-neutral governance, which helps keep the project aligned with broad industry needs rather than a single commercial agenda.
As adoption has grown, OpenTelemetry has become a widely used foundation for modern telemetry. That momentum gives organizations more confidence to invest in instrumentation, supported by a mature ecosystem, strong community, and ongoing contributions from major technology vendors and practitioners.
Telemetry shows up in very concrete ways in real systems. Logs capture events like failed connection attempts with context, application exceptions with full stack traces, and business-critical transactions recorded for auditing.
Metrics quantify measurable signals over time, such as CPU utilization hitting 85%, HTTP throughput peaking at 1,200 requests per second during traffic spikes, or average response latency holding around 150 milliseconds.
Traces map complete request journeys. For example, when a user adds an item to their cart, the request may trigger calls to authentication, product catalog, cart services, pricing, and recommendations. Each step becomes a span in the trace, making it easy to see where time is spent and where bottlenecks or failures occur.
OpenTelemetry and Jaeger are complementary, not competing tools. OpenTelemetry provides the APIs, SDKs, and Collector pipeline used to generate, process, and export telemetry from your applications and services. It’s the instrumentation layer that helps you produce traces, metrics, and logs in a consistent way and route them to the backend(s) you choose.
Jaeger, by contrast, is a distributed tracing backend. It’s an open-source system used to store, index, and visualize traces so teams can troubleshoot microservices and understand request flows. Unlike OpenTelemetry, Jaeger focuses on tracing and does not aim to be a full logs-and-metrics platform. In a typical setup, OpenTelemetry instruments your services and exports trace data (often via OTLP) to Jaeger, where you explore traces through Jaeger’s UI and query capabilities.
OpenTelemetry APIs define the language-specific interfaces used to instrument application code and record telemetry in a standardized way. Because the APIs are designed per language, they fit naturally into each runtime and help teams keep instrumentation consistent across different stacks.
OpenTelemetry SDKs implement those APIs and provide the operational plumbing to collect, process, and export telemetry to one or more backends. The SDK handles details like buffering, sampling, batching, retry logic, and context propagation across service boundaries. This separation between API and SDK gives developers a stable instrumentation surface while allowing the underlying implementation to evolve for performance, reliability, and new capabilities.
OpenTelemetry was developed under the Cloud Native Computing Foundation (CNCF) with a clear goal: to standardize how telemetry is collected and exported across the industry. The project emerged from the strategic merger of OpenTracing and OpenCensus, two initiatives that fragmented the ecosystem by promoting competing approaches.
This consolidation aimed to remove that fragmentation, which forced developers to choose between incompatible standards and pushed tool vendors to support multiple formats. By bringing efforts together, the CNCF created a single project backed by contributions from many of the world’s largest technology companies. This collaborative, vendor-neutral governance helps ensure OpenTelemetry evolves based on real user needs rather than the commercial interests of any one player, supporting long-term stability and portability.
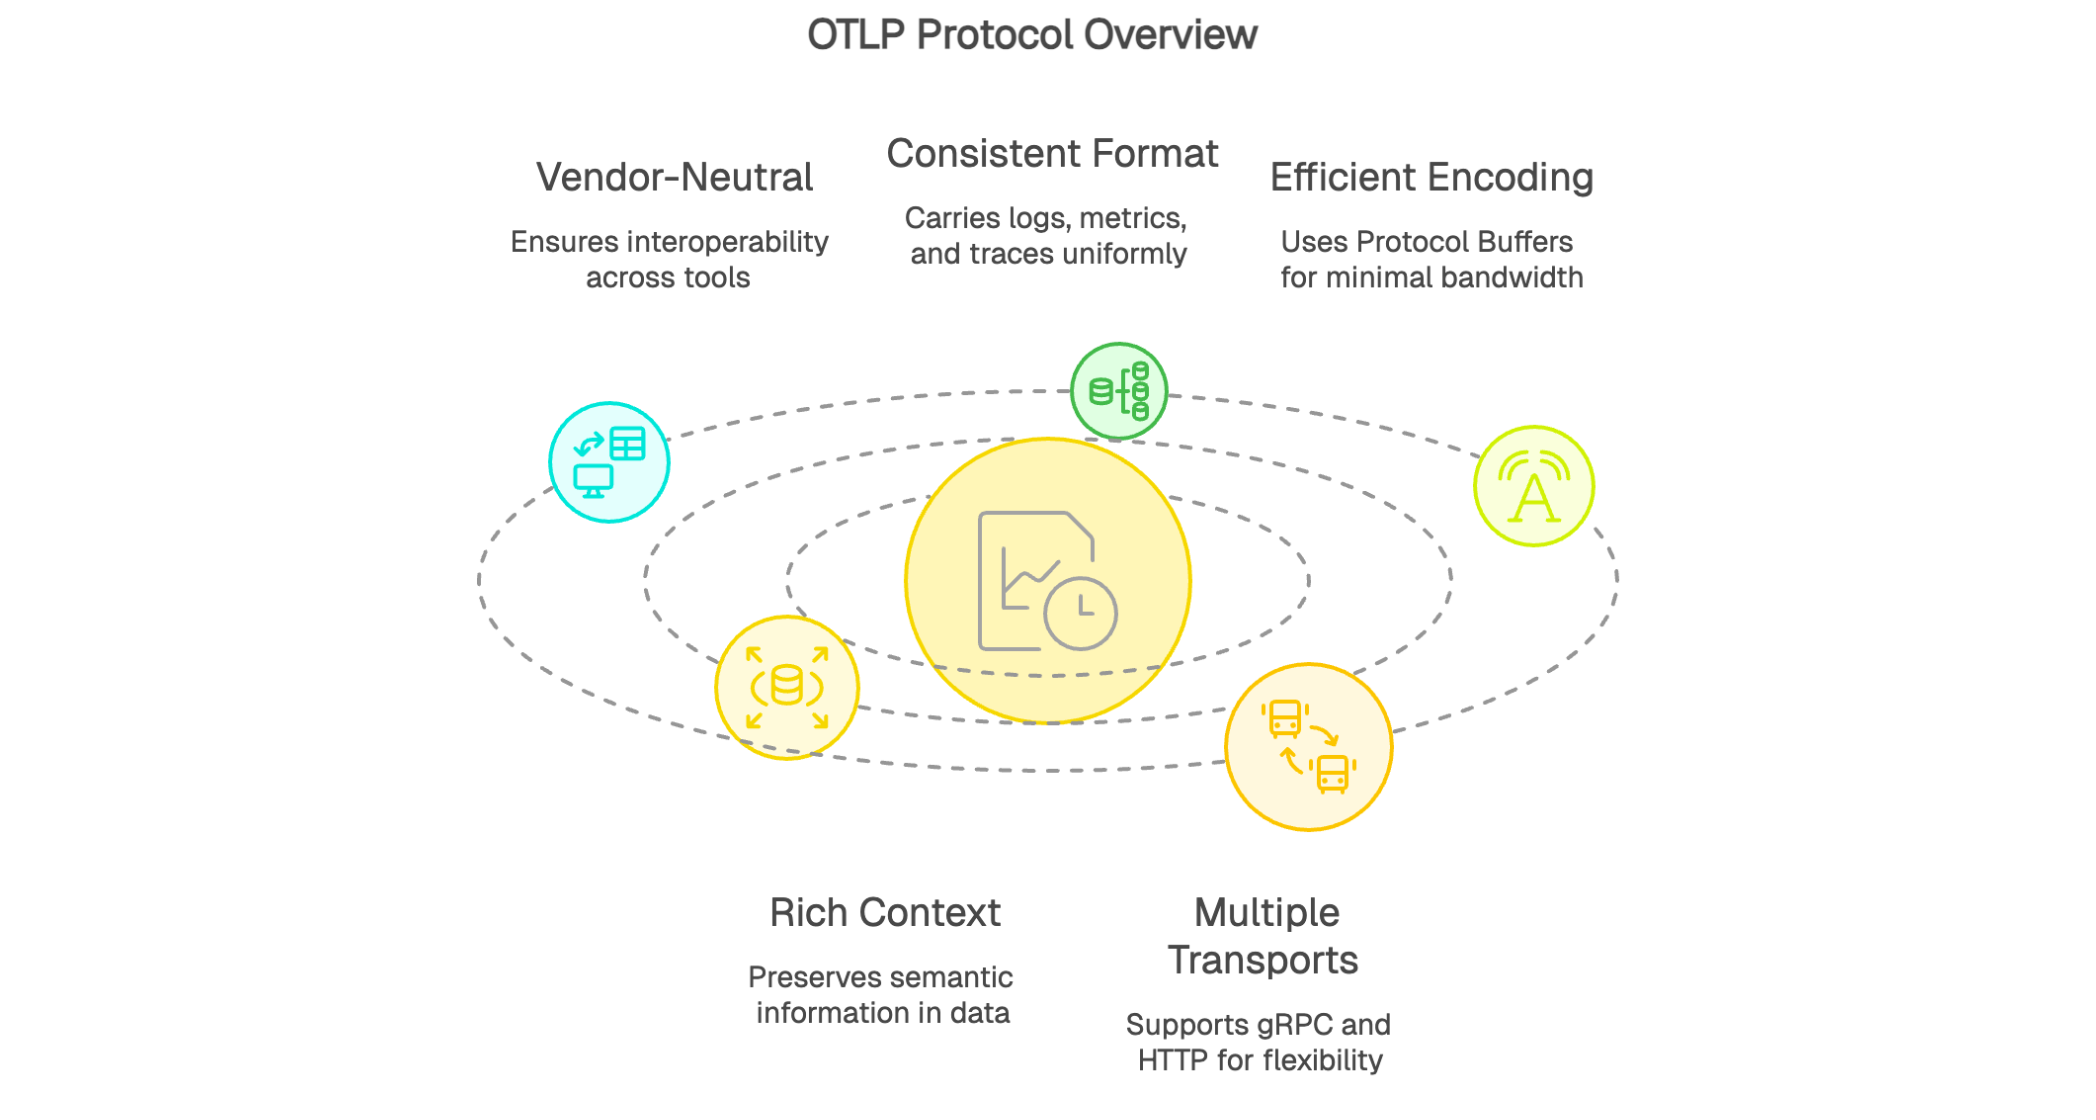
The OpenTelemetry Protocol (OTLP) is the default protocol used across the OpenTelemetry ecosystem to transport telemetry. It’s a vendor-neutral standard designed to efficiently move data between OpenTelemetry components (SDKs, Collectors) and observability backends.
OTLP’s value comes from consistency: it can carry logs, metrics, and traces in a standardized format, which simplifies interoperability across tools and vendors and strengthens the reliability of the telemetry pipeline. It uses efficient binary encoding via Protocol Buffers, minimizing bandwidth while preserving rich semantic context. OTLP also supports multiple transports, including gRPC and HTTP, so it can adapt to different network and deployment constraints.
The OpenTelemetry Collector is a standalone, vendor-neutral service that receives telemetry from multiple sources, processes it using configurable pipelines, and exports it to one or more backends. Its flexibility makes it a central building block in many modern observability architectures.
The Collector is especially useful for processing tasks like filtering (to remove sensitive or low-value data), aggregation (to reduce volume and cost), and transformation (to enrich telemetry with consistent context). It can handle multiple protocols and formats in a single deployment, which makes it well suited for unifying heterogeneous environments. In a Kubernetes cluster, for example, a Collector can ingest OTLP traces from microservices, Prometheus-style metrics via scraping or receivers, and logs from common log protocols, then normalize them and route each signal to the appropriate analytics platform.
Rolling out OpenTelemetry typically works best as a phased approach: it reduces risk while delivering value early. Start with a representative pilot service and add the appropriate OpenTelemetry SDK for its language runtime.
Next, enable auto-instrumentation to capture baseline telemetry with minimal manual effort. This helps teams validate the signal quality quickly and get comfortable with traces, metrics, and logs before investing in deeper customization. Deploy an OpenTelemetry Collector to centralize ingestion, apply processing (filtering, enrichment, transformations) as needed, and route telemetry to your chosen observability backend. Configure exporters so logs, metrics, and traces land in the right destinations.
Once the initial setup is stable, expand to additional services gradually. As you scale coverage, add manual spans and custom metrics to capture domain-specific events and business-critical flows. This iterative rollout lets you learn in production, standardize patterns across teams, and build a durable observability foundation without trying to boil the ocean on day one.