.svg)

.svg)


Testing
TESTING

Automated testing to validate user experiences across real devices, networks, and channels.
Features
CHANNELS
Automated testing to validate user experiences across real devices, networks, and channels.
As software systems grow more complex and user expectations keep rising, traditional testing approaches are starting to hit their limits. Validating quality only during development is no longer enough to ensure a reliable, high-performing experience in the real world. That’s where Shift Right Testing comes in: it extends testing beyond release by validating application behavior in production (or production-like environments), using real traffic patterns, real dependencies, and real user conditions.
Shift Right Testing doesn’t replace existing practices. It strengthens them by adding visibility across the full application lifecycle. It helps teams uncover unexpected usage scenarios, measure performance under real constraints, and reduce user-facing risk through controlled experiments and continuous validation. Let’s look at how Shift Right Testing is changing the way teams approach software quality.
Summary
1.
Understanding Shift Right Testing
2.
Shift Right vs Shift Left: complementary, not contradictory
3.
Why Shift Right has become essential
4.
The strategic benefits of Shift Right Testing
5.
Practical guide: how to implement Shift Right Testing
6.
Shift Right Testing methods in detail
7.
The ecosystem of tools for Shift Right Testing
8
Best practices and recommendations
9.
Towards sustainable operational excellence
10.
Shift Right Testing covers the testing and validation practices performed after an application is deployed, either in production or in environments that closely mirror real usage. Unlike traditional approaches that concentrate validation before release, Shift Right extends quality checks beyond go-live. The goal is to continuously verify system behavior, measure real-world performance, and detect anomalies quickly before they meaningfully impact users.
This approach typically rests on three pillars: continuous monitoring in production, analysis of real user signals (or realistic traffic patterns), and fast incident response. By testing in production conditions, teams can validate that the application behaves correctly under real load, diverse user behavior, and the full complexity of its dependencies and ecosystem.
Shift Left Testing promotes moving testing earlier in the software development lifecycle. The goal is to catch defects as soon as possible, which lowers the cost of fixes and speeds up delivery. Unit tests, code reviews, and early validation are core practices in a Shift Left approach.
Shift Right Testing doesn’t compete with that, it complements it. Shift Left focuses on prevention upstream. Shift Right validates behavior downstream under real operating conditions. Together, they create a continuous testing loop across the full lifecycle, from design and development to deployment and operations. This end-to-end view helps teams improve software quality at every stage.
Modern production environments are more complex than ever. Microservice architectures, distributed cloud infrastructure, and a web of third-party integrations create conditions that are difficult to reproduce faithfully in a test environment. In many cases, validating behavior under real operating conditions is the only way to uncover issues that don’t appear in staging.
User behavior adds another layer of unpredictability. Even with well-designed test scenarios, you can’t anticipate every interaction pattern. Real traffic often differs from simulations, and user journeys don’t always follow the happy path.
Shift Right Testing captures these realities and helps teams continuously adapt based on observed usage. In a world where 24/7 availability is expected, the ability to detect issues quickly and respond in real time becomes essential for maintaining service reliability.
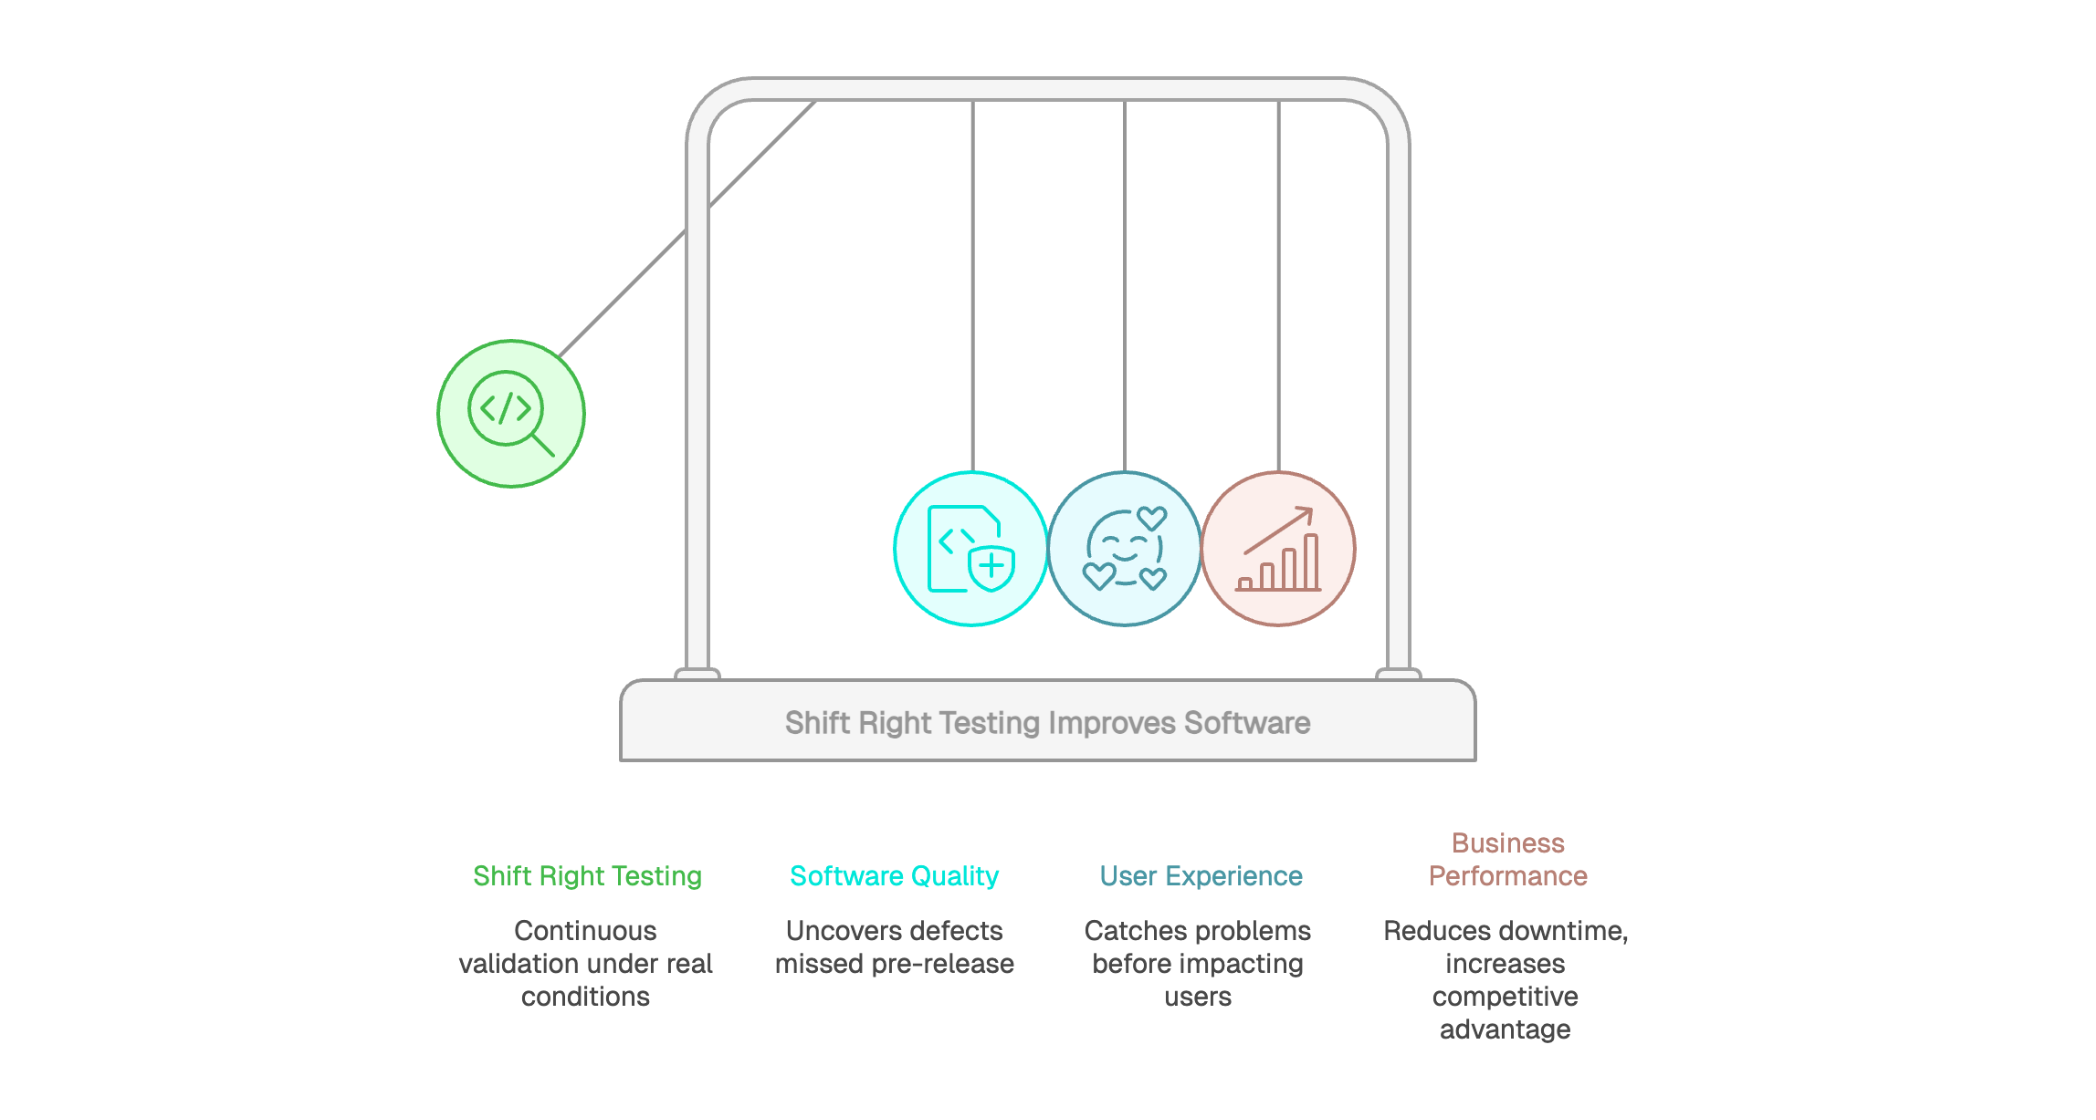
For software quality, Shift Right Testing enables continuous validation under real execution conditions. It helps uncover defects that pre-release testing can miss, especially those triggered by real traffic, unexpected user behavior, or complex cross-service interactions.
By combining continuous monitoring, production data analysis, and fast response to anomalies, teams can detect and fix user-impacting issues earlier. The result is higher application reliability and a better end-user experience, even after a feature is live.
A major benefit of Shift Right Testing is catching problems before they impact users at scale. With proactive monitoring and progressive delivery techniques (canary releases, feature flags, phased rollouts), teams can detect anomalies early and fix them within a limited blast radius before they spread. This approach minimizes incident impact across the broader user base.
Optimization based on real usage data also drives continuous improvement. Instead of relying on assumptions or small-sample user tests, teams can work with concrete evidence about perceived performance, friction points, and real user journeys. That real-world visibility helps prioritize the right work and ensures improvements address actual needs, which can translate into higher customer satisfaction over time.
Reducing downtime can deliver a clear financial payoff. Every minute of unavailability can translate into lost revenue, higher support load, and damaged brand trust. Shift Right Testing helps teams detect issues earlier and contain impact before they escalate into major outages, supporting stronger service continuity.
Competitive advantage is another strategic benefit. Companies that can ship features faster while maintaining reliability tend to outpace slower competitors. Shift Right Testing supports that pace by validating changes under real operating conditions and surfacing risks early in the rollout. It can also improve infrastructure ROI by helping teams allocate resources based on observed demand and real bottlenecks, rather than assumptions. This data-driven approach increases the efficiency of every dollar invested in your platform.
A continuous monitoring setup is the backbone of Shift Right Testing. Application Performance Monitoring (APM) tools collect critical signals in real time, including latency, error rate, resource utilization, and service availability. This always-on visibility helps teams spot performance degradation quickly and investigate what’s driving it.
Unified dashboards bring these signals together into a single operational view. Automated alerts tied to clear thresholds help teams respond before issues escalate. Storing telemetry over time also enables trend analysis and pattern detection, which supports ongoing reliability work and prevents repeat incidents. In short, continuous monitoring shifts operations from reactive firefighting to proactive control.
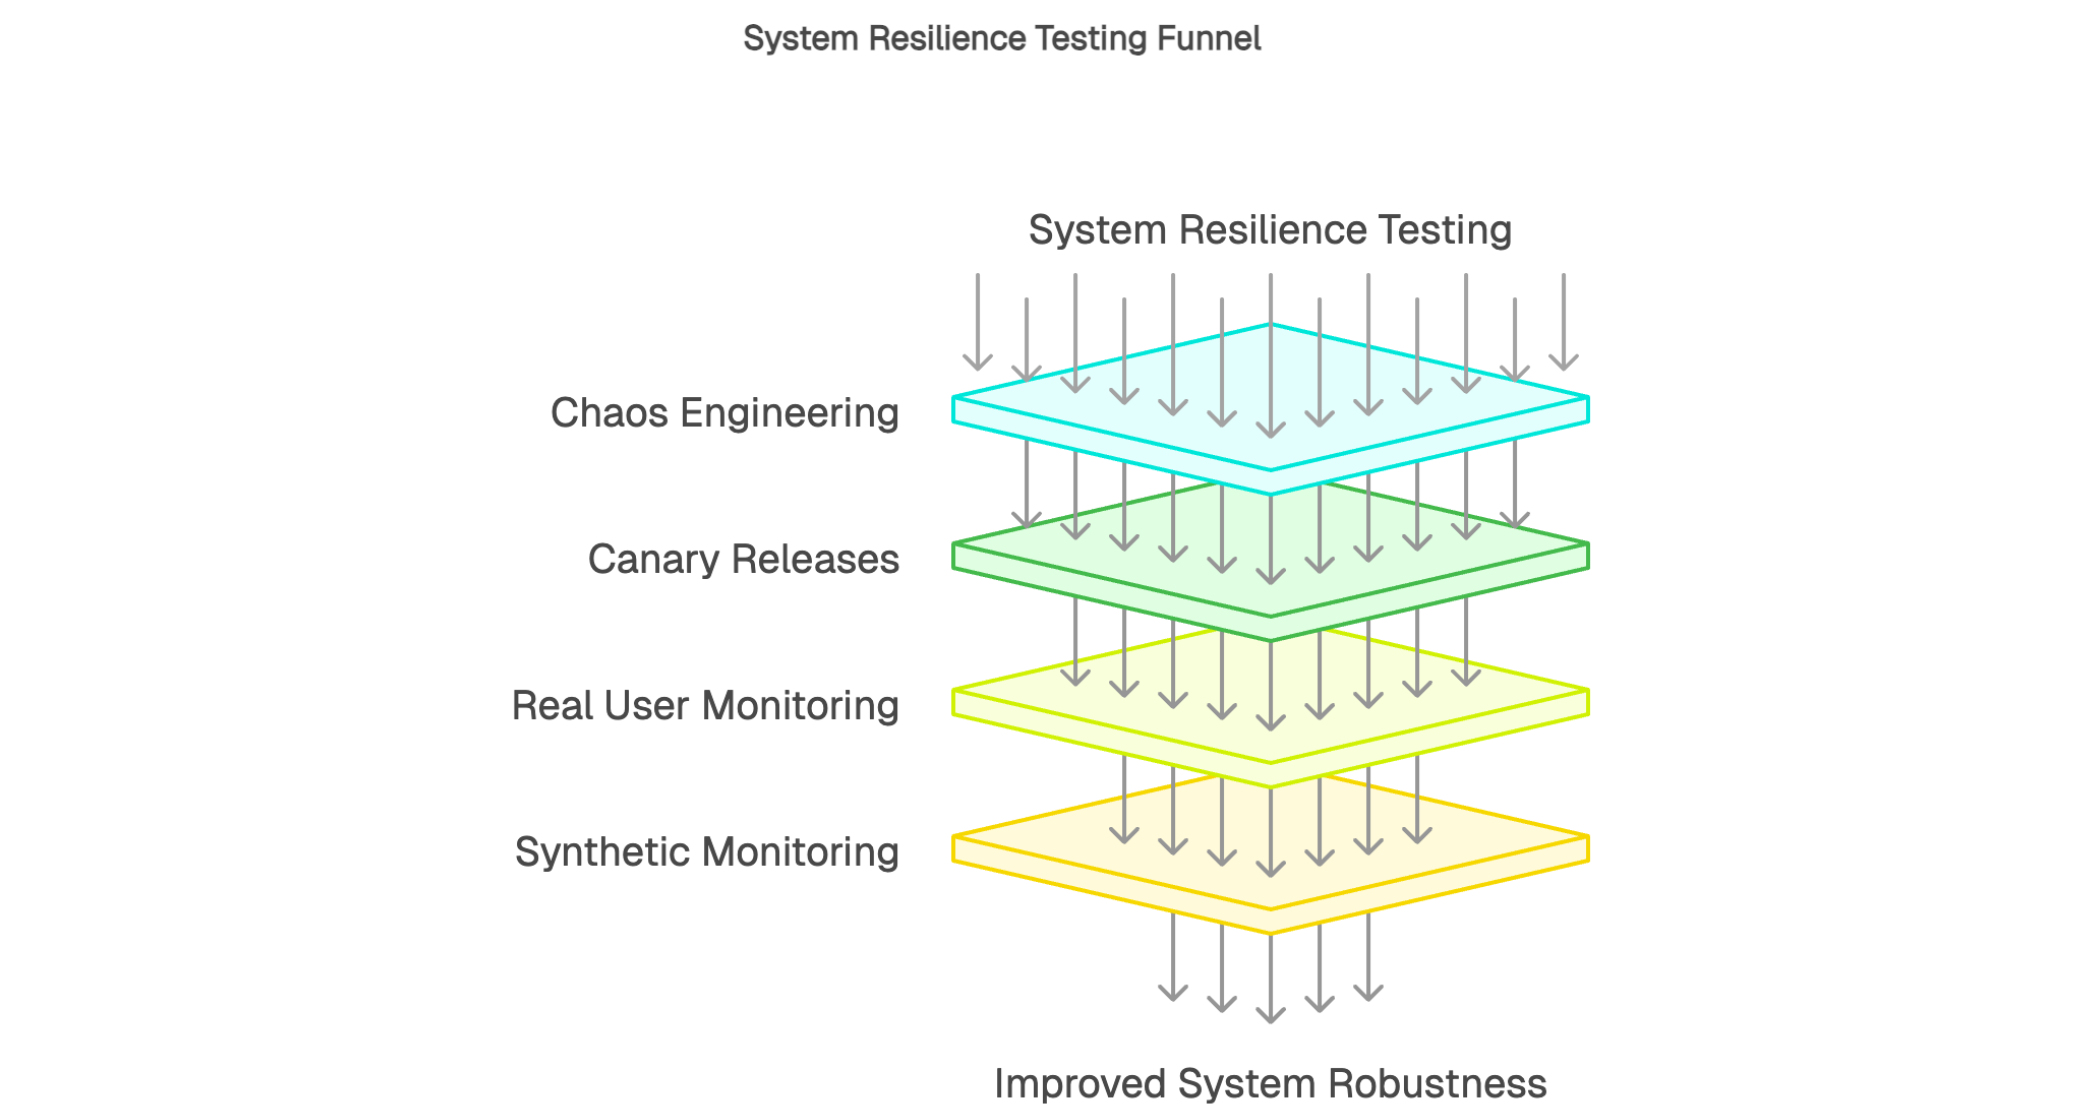
Real User Monitoring (RUM) captures what users actually experience when they interact with an application.
Unlike synthetic tests that simulate journeys, RUM measures real-world performance in production: page load time, network latency, JavaScript errors, and interaction responsiveness. This data reflects user experience as it happens across real devices, browsers, and network conditions.
Behavioral analysis adds another layer by showing the paths users take, which features they use most, and where drop-offs occur. These insights help teams prioritize improvements based on real impact. By connecting technical performance signals with experience and outcome indicators (completion rate, conversions, support tickets, or user feedback), teams get a clearer picture of what matters and can target optimizations with the highest business value.
Synthetic monitoring runs scripted user journeys automatically in production-like conditions. It executes predefined scenarios on a schedule to validate availability and performance of critical flows before real users run into problems.
Unlike approaches that rely on real traffic to surface issues, synthetic monitoring can detect regressions early. Scenarios typically cover high-value journeys such as authentication, checkout, access to sensitive data, and critical API calls. Tests run continuously, often from multiple geographic locations, to provide broad coverage across key paths. Execution frequency can be tuned based on criticality, with some journeys validated every minute and others every hour.
When a step fails or performance degrades, synthetic monitoring triggers alerts so teams can respond quickly. This early warning reduces time to detection, speeds incident resolution, and helps protect user experience before issues impact users at scale.

Canary testing is a proven way to validate new versions under real-world conditions while limiting risk. It works by rolling out changes to a small percentage of users first, then expanding gradually once results look healthy. Canary traffic is monitored more closely, so teams can detect anomalies, error spikes, or performance regressions quickly.
Phased rollout has several advantages. It lets you validate stability in production without exposing the entire user base. If issues appear, the blast radius stays small and rollback (or a quick fix) is straightforward. This controlled approach helps teams ship with confidence while maintaining delivery velocity. Monitoring during rollout also provides useful signals on feature adoption and real usage, not just whether the release “worked.”
In production, Shift Right Testing often relies on automated post-deployment checks to catch critical functional regressions early. These validations are typically non-disruptive: they confirm that essential workflows still work after a release or bug fix without interfering with real users.
When integrated into continuous delivery pipelines, these checks run automatically after each production deployment, with no manual effort required. They complement pre-release regression testing by adding verification under real operating conditions. The result is higher confidence in frequent releases while reducing the risk of unintended side effects reaching users.
Fault injection testing deliberately introduces controlled failures in production-like environments to validate system resilience. It can sound counterintuitive, but it’s one of the most effective ways to verify that fault-tolerance mechanisms work as intended. Common experiments include simulating network partitions, third-party dependency outages, and resource exhaustion or overload.
Chaos engineering extends the same idea by exploring more complex, multi-factor failure scenarios where second-order effects are harder to predict. The goal is to surface weaknesses before they turn into real incidents. This is especially valuable for high-availability systems, where improving robustness and recovery behavior directly impacts reliability. Running these experiments regularly builds confidence that the system can withstand disruption and recover gracefully.
A collect-analyze-improve feedback loop is what powers continuous optimization. Telemetry from monitoring and testing builds a clearer picture of how the application behaves in production. That visibility guides engineering decisions and helps teams prioritize work based on real impact to user experience and performance.
A continuous improvement culture depends on this kind of data-driven operating model. Instead of relying on intuition, teams validate decisions with measurable evidence. Each release is evaluated against production metrics, creating a steady cycle of learning and optimization. Over time, this disciplined approach helps ensure engineering effort translates into measurable gains in reliability, experience, and customer satisfaction.
Chaos engineering systematically tests system resilience by injecting controlled failures into production-like environments. The goal is to surface weaknesses before they turn into real incidents. Common chaos experiments include terminating services, introducing network latency or packet loss, and simulating infrastructure failures.
Finding weak points enables proactive improvements in fault tolerance. Each experiment exposes vulnerabilities and informs architectural hardening, whether that means better timeouts, retries, circuit breakers, load shedding, or stronger redundancy. For high-availability applications, this approach helps ensure services keep operating even when dependencies fail. In short, chaos engineering turns uncertainty into evidence, giving teams more confidence in system robustness.
Canary deployment limits a new version to a small percentage of users at first. This cautious rollout lets teams validate stability under real-world conditions before expanding to the full user base. Canary traffic is monitored closely, with key health and performance signals tracked to catch regressions early.
The main advantage is risk reduction. If issues appear in the canary cohort, the rollout can be paused or rolled back before it impacts everyone.
This gradual validation helps teams ship to production frequently without sacrificing control. Canary deployments strike a strong balance between delivery speed and operational safety.
RUM captures real-time signals about user experience as people interact with your application. It reflects perceived performance in production, including load speed, interaction responsiveness, client-side errors, and network latency. Unlike synthetic tests that simulate predefined journeys, RUM shows what happens across the real diversity of devices, browsers, and network conditions.
Analyzing performance and UX friction points helps teams identify where to focus first. RUM data highlights which pages are slow, where users drop off, and which features create errors or degraded experience for specific segments. This real-world visibility makes optimization more effective by targeting the changes with the highest impact. In practice, RUM turns everyday sessions into a continuous feedback stream for improving service quality.
Synthetic monitoring runs scripted simulations continuously to validate the availability and performance of critical journeys. Because it operates 24/7, it can catch issues during low-traffic periods when RUM alone might not surface problems quickly. In other words, synthetic testing improves time to detection, regardless of when an incident occurs.
Running tests from multiple geographic locations also provides visibility into regional performance differences. A site may feel fast for users in Europe but slow in APAC. Multi-location synthetic monitoring helps teams spot these gaps and prioritize optimizations that improve overall service quality.
Comparing synthetic monitoring with RUM makes their complementarity clear. Synthetic monitoring is proactive: it can flag regressions early by validating known critical paths. RUM measures what real users actually experience across real devices and networks. Together, they form a coherent monitoring strategy that combines early warning with real-world validation. Common use cases include continuous checks for critical transactions, API availability monitoring, and response-time validation on high-value business flows.
Application Performance Monitoring (APM) is a core capability for Shift Right Testing. These platforms collect key technical signals such as transaction latency, throughput, error rates, and resource utilization (CPU and memory). Through instrumentation, APM traces requests end to end across services and layers, helping teams see where time is spent and where failures originate.
Log management platforms such as the ELK Stack, Splunk, and Graylog centralize and structure logs generated across the stack. These tools turn high-volume, often noisy data into actionable signals. Powerful search and filtering make it possible to investigate incidents quickly and spot suspicious patterns.
Event correlation is especially valuable for root cause analysis. A production incident can generate thousands of log lines, many of them redundant. Good tooling helps reduce noise, group related events, and connect symptoms back to the underlying cause. This can significantly speed incident response and improve understanding of system behavior over time. Long-term log retention also supports post-incident reviews and trend analysis.
Product analytics tools like Google Analytics, Mixpanel, and Amplitude focus on understanding user behavior from a product and business perspective. They capture product events such as clicks, sign-ups, conversions, key journeys, and engagement signals. This data complements technical telemetry by connecting performance and reliability to the value users are actually getting.
Insights into user preferences and flows help guide product decisions. Knowing which features are used, which are ignored, and where users drop off helps teams prioritize the roadmap. Behavioral analysis also exposes the gap between intended and actual usage, which is often where the best product learnings live. With that clarity, teams can focus engineering effort on changes that deliver the highest business impact.
The synthetic monitoring market includes a wide range of solutions designed for different use cases and maturity levels. Key selection criteria typically include test location coverage, run frequency, supported journey types (browser, API, mobile), and the depth of alerting and escalation options. Some platforms focus primarily on website journeys, while others are stronger for API monitoring, mobile testing, or more advanced scripting and orchestration.
Kapptivate fits into this landscape as a synthetic monitoring platform designed to be easy to adopt without requiring deep DevOps expertise. Teams can build and run complex test journeys through an intuitive interface, without heavy scripting or specialized tooling. Broad geographic coverage also helps teams understand regional performance differences and detect location-specific issues earlier.
Kapptivate’s value increases when it plugs into the rest of your monitoring stack. Alerts can flow into existing incident management tools, and collected metrics can feed unified dashboards alongside infrastructure and application signals. This interoperability helps teams leverage existing processes, reduce tooling friction, and scale proactive monitoring across more teams focused on software quality.
A multi-tool approach is standard in mature organizations. Each tool category answers different questions: APM tracks technical performance, logs support investigation, product analytics reveals real usage, synthetic monitoring provides proactive detection, and feedback tools capture user sentiment. When these signals are connected, teams get a far clearer picture than any single tool can provide.
Centralizing key signals in unified dashboards makes that visibility usable day to day. Instead of jumping between multiple interfaces, teams can monitor a shared set of indicators in one place, spot issues faster, and coordinate response more effectively. When tools are integrated into a coherent strategy, the result is more than “more data”, it’s actionable insight that supports continuous improvement.
Adopting Shift Right Testing works best as an incremental rollout. Start by identifying the critical applications where downtime or failures would create the highest business impact. These systems become your initial scope, helping you prove value quickly while building internal experience.
A practical first step is baseline monitoring: implement availability checks, capture essential performance signals, and configure alerts for high-severity incidents. Once those foundations are stable, expand coverage gradually by adding richer synthetic journeys, rolling out RUM, and introducing canary deployment practices. This phased ramp-up helps teams absorb new workflows without disrupting existing delivery processes.
Performance indicators should map directly to business and technical objectives. Core performance metrics typically include latency (response time), throughput, and error rate. Availability indicators track uptime and service reliability over time, often paired with incident metrics like outage count and time to recovery. These technical KPIs are stronger when complemented by experience signals such as NPS or CSAT, especially when you want to connect system health to customer outcomes.
Setting meaningful alert thresholds is critical. Thresholds that are too sensitive create noise and alert fatigue. Thresholds that are too loose miss real issues until users complain. Getting this right takes iteration and should be grounded in historical data, baseline performance, and clear definitions of what “user impact” looks like. Well-chosen KPIs and properly tuned alerting turn monitoring into a practical tool for managing software quality, not just a dashboard collection.
DevOps is built on shared responsibility between engineering and operations. Shift Right Testing strengthens that model by making production quality a team sport, not an ops-only concern. Training engineers in observability helps them build services that are easier to instrument, monitor, and debug. Training ops teams in production testing practices improves their ability to interpret signals, validate fixes, and respond effectively when conditions change.
In that context, observability skills become essential. Teams need to know how to instrument services correctly, define meaningful metrics, and interpret telemetry in a way that leads to action. Incident management should evolve as well, incorporating richer context and proactive detection so teams can reduce time to detection and shorten recovery. Investing in training increases the ROI of your tooling by ensuring people can actually use it under real pressure.
Automation is one of the biggest efficiency drivers in Shift Right Testing. Automated synthetic checks run continuously without manual effort, keeping visibility steady regardless of staffing, schedules, or on-call load. Smarter alerting, using correlation and deduplication, helps reduce noise so teams are paged for actionable incidents instead of a flood of redundant notifications.
Automated escalation ensures issues that aren’t acknowledged or resolved within defined time windows are routed to the right level of support. Where appropriate, automated remediation can resolve common failures without human intervention, such as restarting unhealthy services, failing over to backup resources, or adjusting capacity during spikes. Done well, this automation reduces repetitive toil and frees teams to focus on reliability work and continuous improvement.
Shift Right Testing is increasingly becoming a core lever for modern software quality. By extending validation beyond deployment, it reduces the gap between pre-release testing and real operational conditions. The ability to monitor, analyze, and improve system behavior continuously in production is changing how organizations manage reliability and service quality.
Proactive monitoring, especially synthetic monitoring, plays a central role in this model. Detecting anomalies early, before they impact users at scale, can be a meaningful advantage in environments where user experience is a key differentiator. The practices and technologies covered in this article help teams strengthen observability and build a culture of continuous optimization grounded in real data.
Getting started with Shift Right Testing is accessible for most organizations. Identify critical applications, implement baseline monitoring, and expand coverage over time with synthetic journeys, RUM, and progressive delivery practices. The benefits often show up quickly: faster detection, better visibility into real performance, and fewer user-facing issues.
In this context, kapptivate supports teams in adopting proactive, production-grade monitoring. By combining ease of adoption with broad coverage, the platform helps organizations move toward sustainable operational excellence without unnecessary complexity.