


.svg)

.svg)


Monitoring
What is OpenTelemetry?
24 Feb

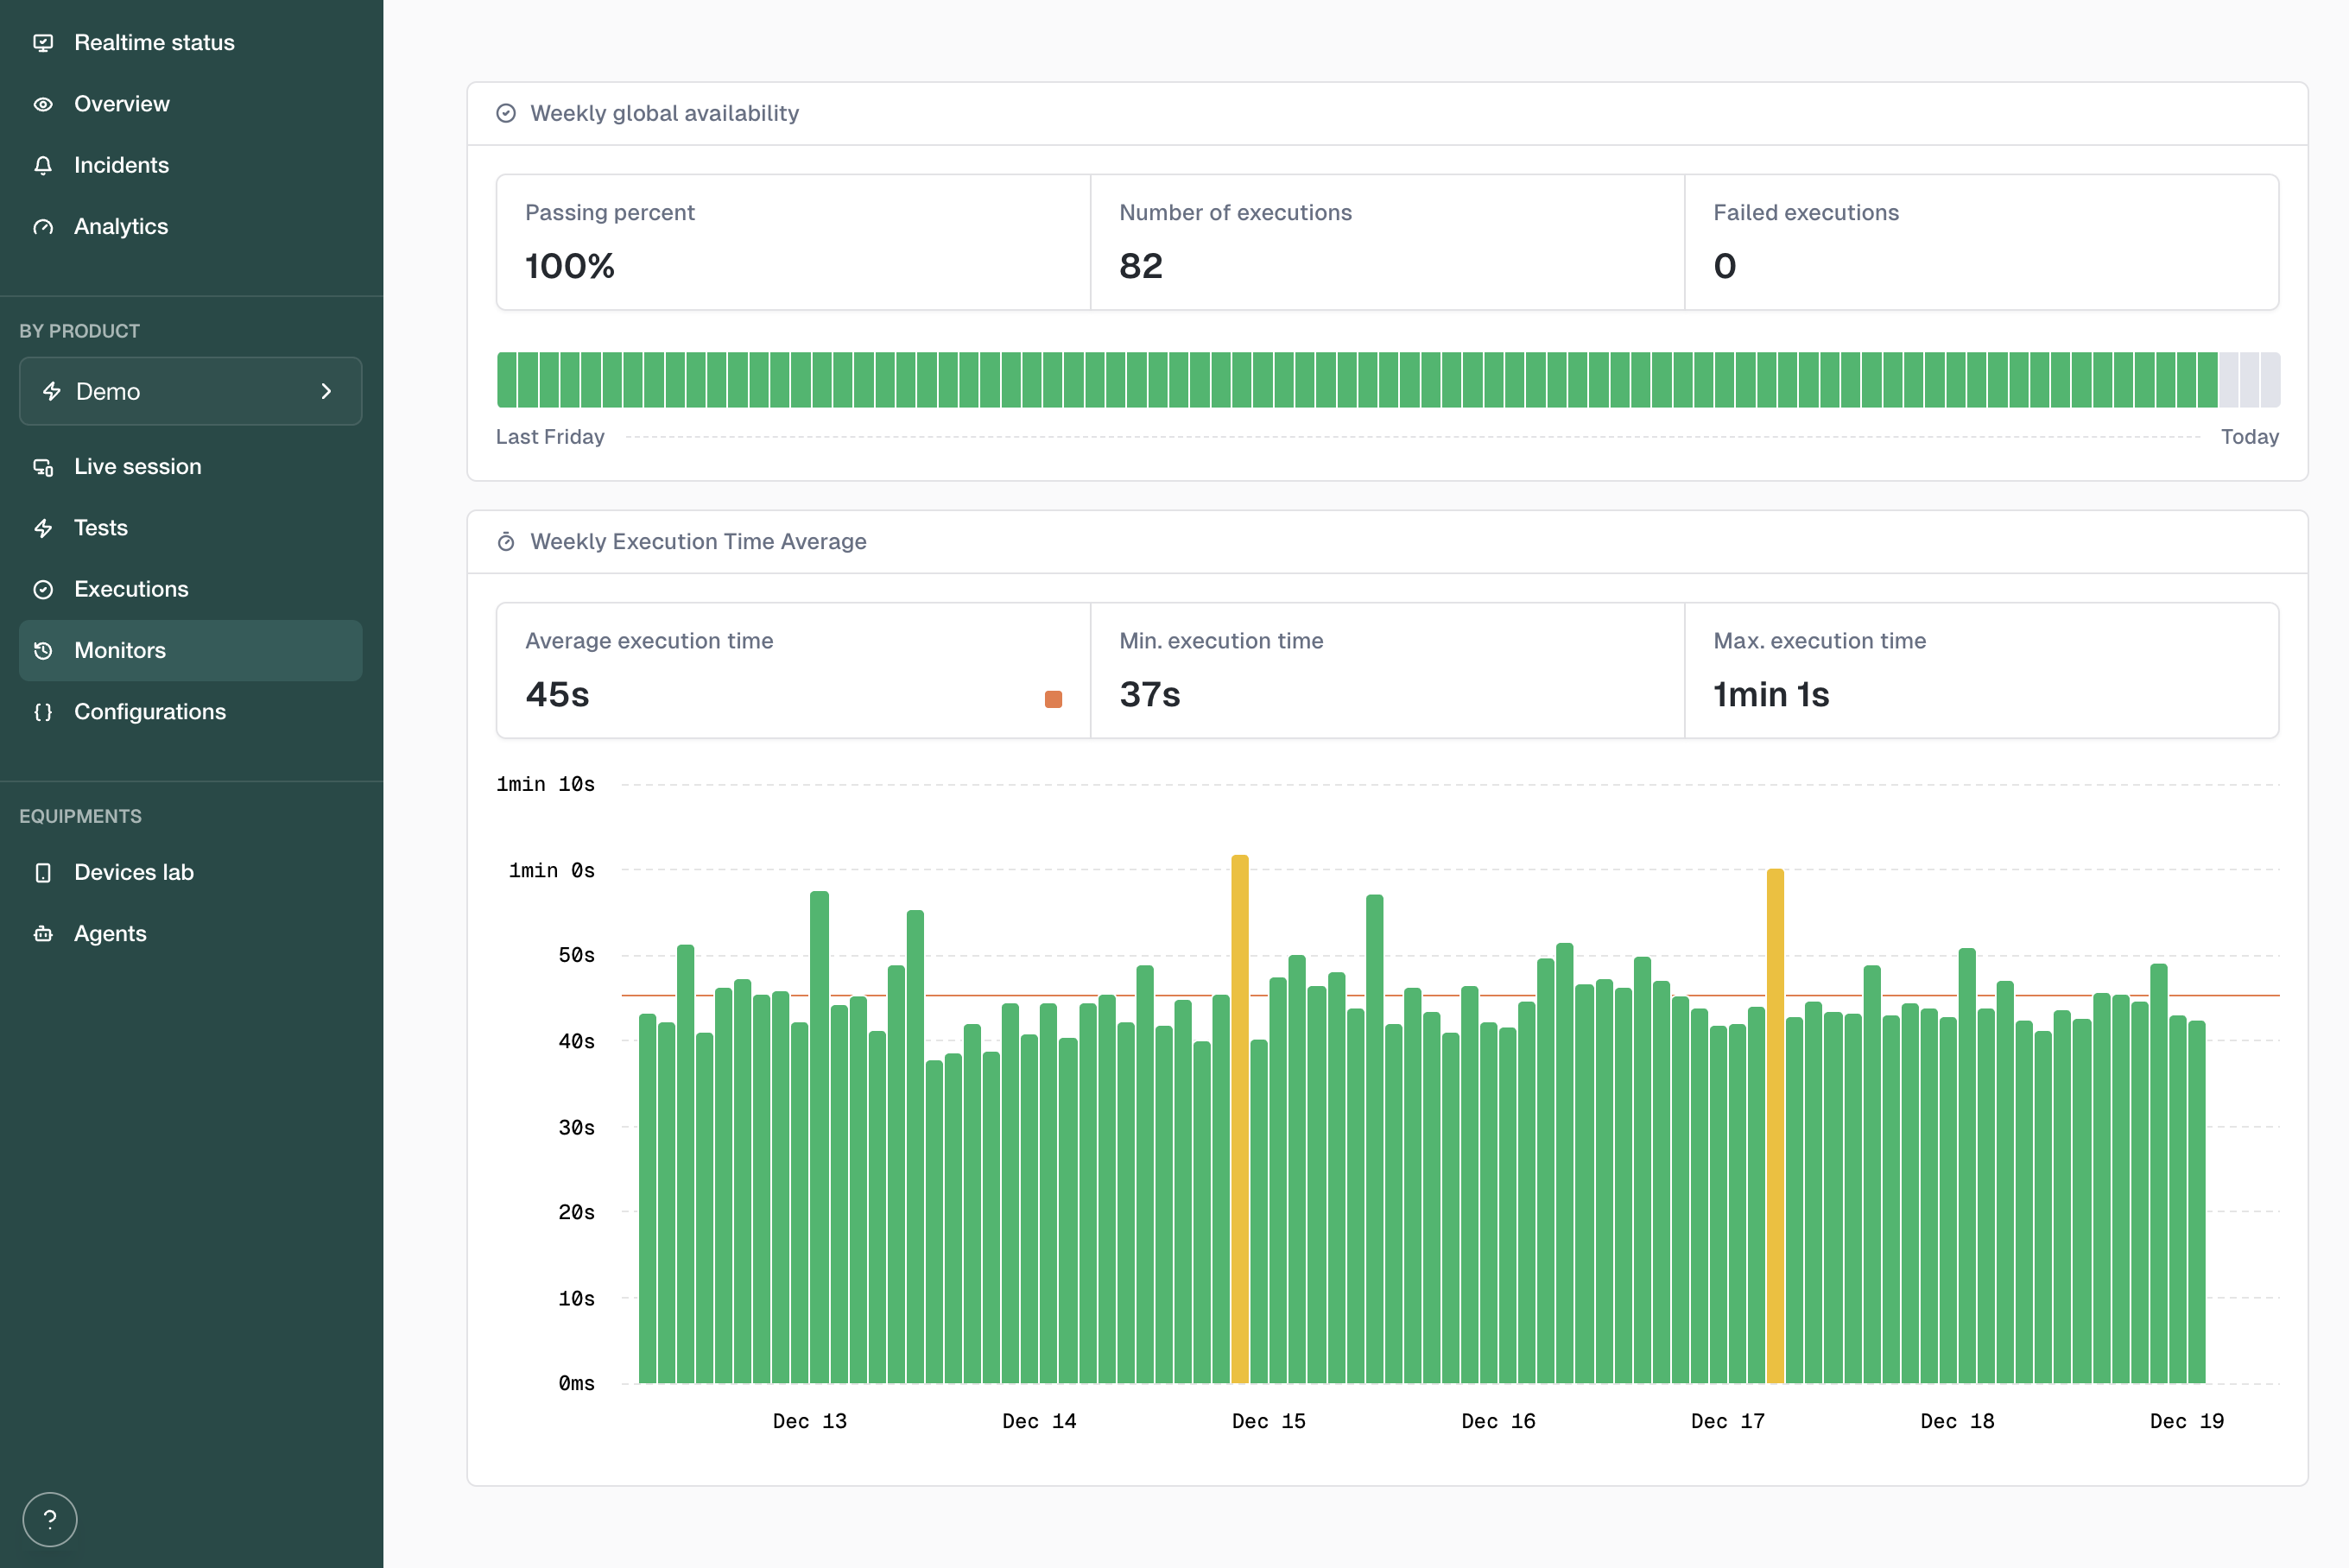
Automated testing to validate user experiences across real devices, networks, and channels.
Digital experience is not defined by server responses alone, it depends on fluidity, responsiveness, visual stability, and perceived satisfaction. With Kapptivate User Experience Monitoring, you continuously track QoE metrics like Web Vitals, load and transition timings, visual stability, and end-to-end journeys to detect friction before it drives abandonment or complaints.
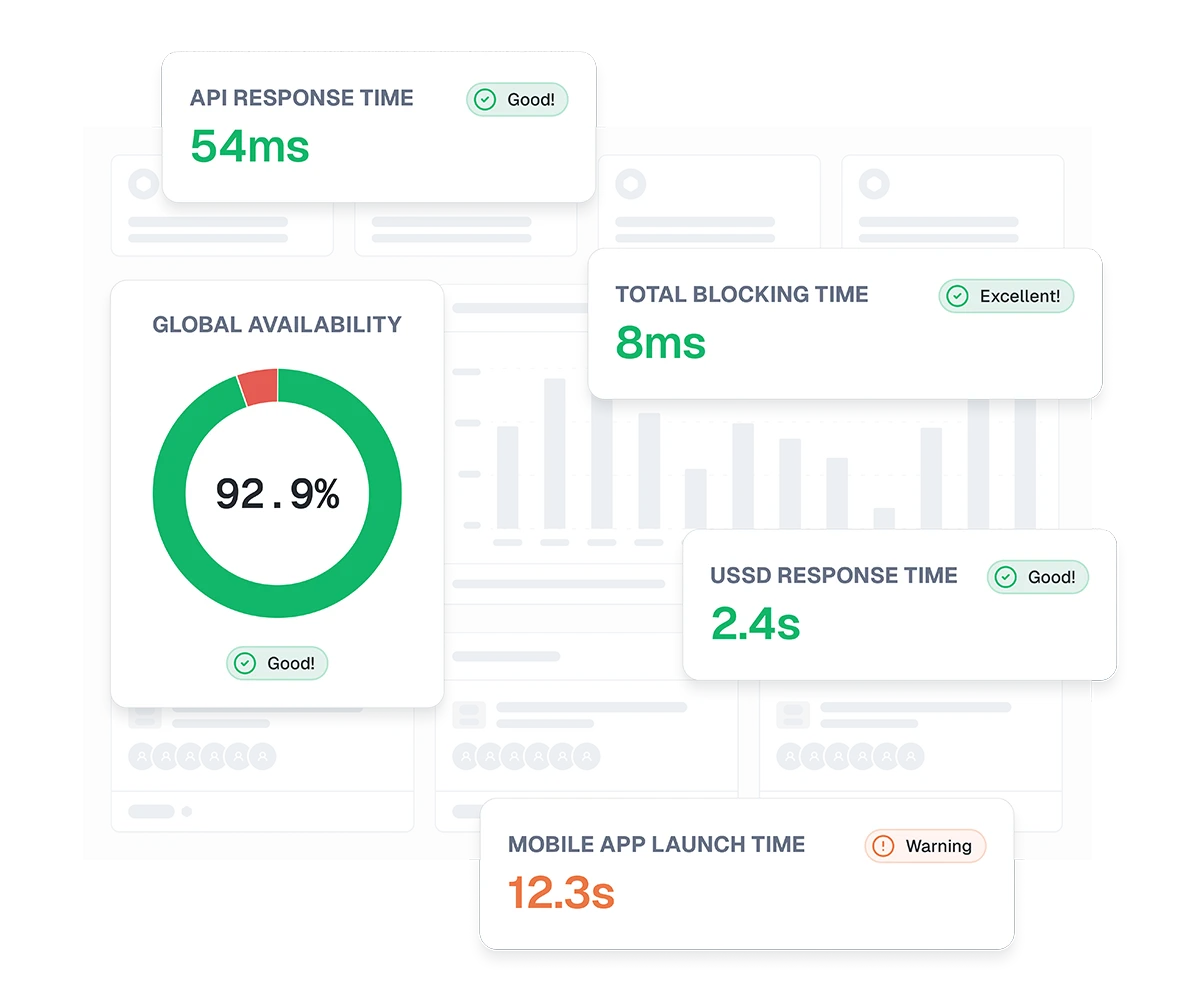
This feature gives you actionable, real-world visibility into the actual user experience, not just the technical health of your systems.
User experience monitoring is essential across any digital service where speed, stability, and usability affect engagement, satisfaction, or revenue.

.webp)
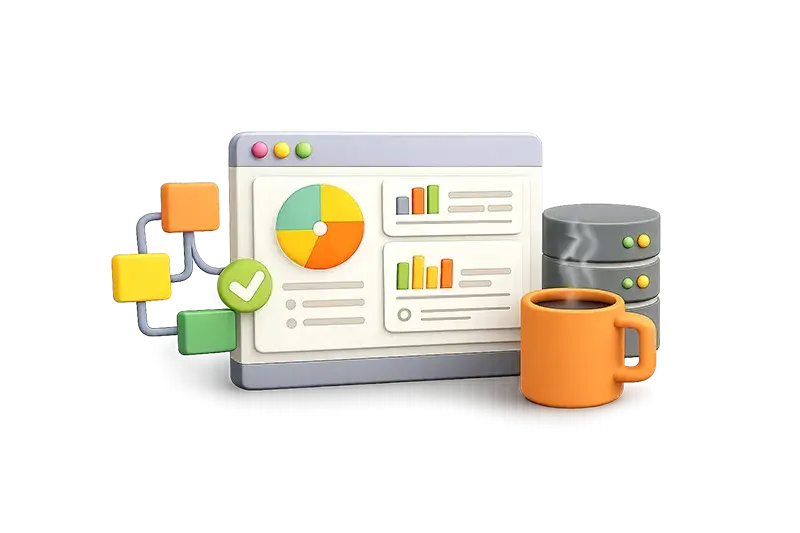

Kapptivate makes user experience measurable, understandable, and improvable, ensuring your digital platforms stay fast, smooth, and satisfying for every user.
.svg)
metrics focused on user perception, not just backend timing
.svg)
detect UX degradation before it impacts real users
.svg)
dashboards accessible to product, UX, marketing, and engineering

shareable reports, BI exports, and observability connectors

no heavy expertise required to configure UX scenarios
.svg)
web, mobile, and performance-by-region
User experience monitoring is part of kapptivate's synthetic monitoring suite measure what your users actually feel, not just what your servers report.